Squid User Manual
A complete guide to installing, configuring and sailing with Squid.
Desktop · PDF · 1305 KB
D-ICE — weather, routes, weather routing and navigation in one map-centred workspace.
Introduction
Squid, developed by D-ICE, brings weather data, route planning, weather routing and navigation tools together in one application, for anyone preparing or managing a voyage at sea — from weekend sailors to professional racing teams.
Available features, weather models and data sources depend on your subscription, licence and software edition — some things described in this manual may not appear for every user.
Safety disclaimer. Squid is a decision-support tool, not the sole source of information for navigation or safety at sea. Forecasts and routing results can be inaccurate or change. The captain or navigator remains responsible for all navigational decisions and for using official charts and safety information.
Installation and First Start
Available for Windows, macOS and Linux. A 64-bit machine with hardware-accelerated graphics/WebGL and 8 GB+ RAM is recommended, with storage headroom for forecasts, imagery and charts. An internet connection is needed to sign in, verify your subscription, download data and check for updates — previously downloaded data stays available offline.
Installing
| OS | How |
|---|---|
| Windows | Run the installer from an official Squid source, then launch from the Start menu or desktop shortcut. |
| macOS | Open the .dmg and drag Squid into Applications. macOS may ask for confirmation the first time it opens. |
| Linux | Install the .deb package with your system's package tools. |
Installing an update should preserve existing settings and data, but back up important routes before a major upgrade.
Signing in
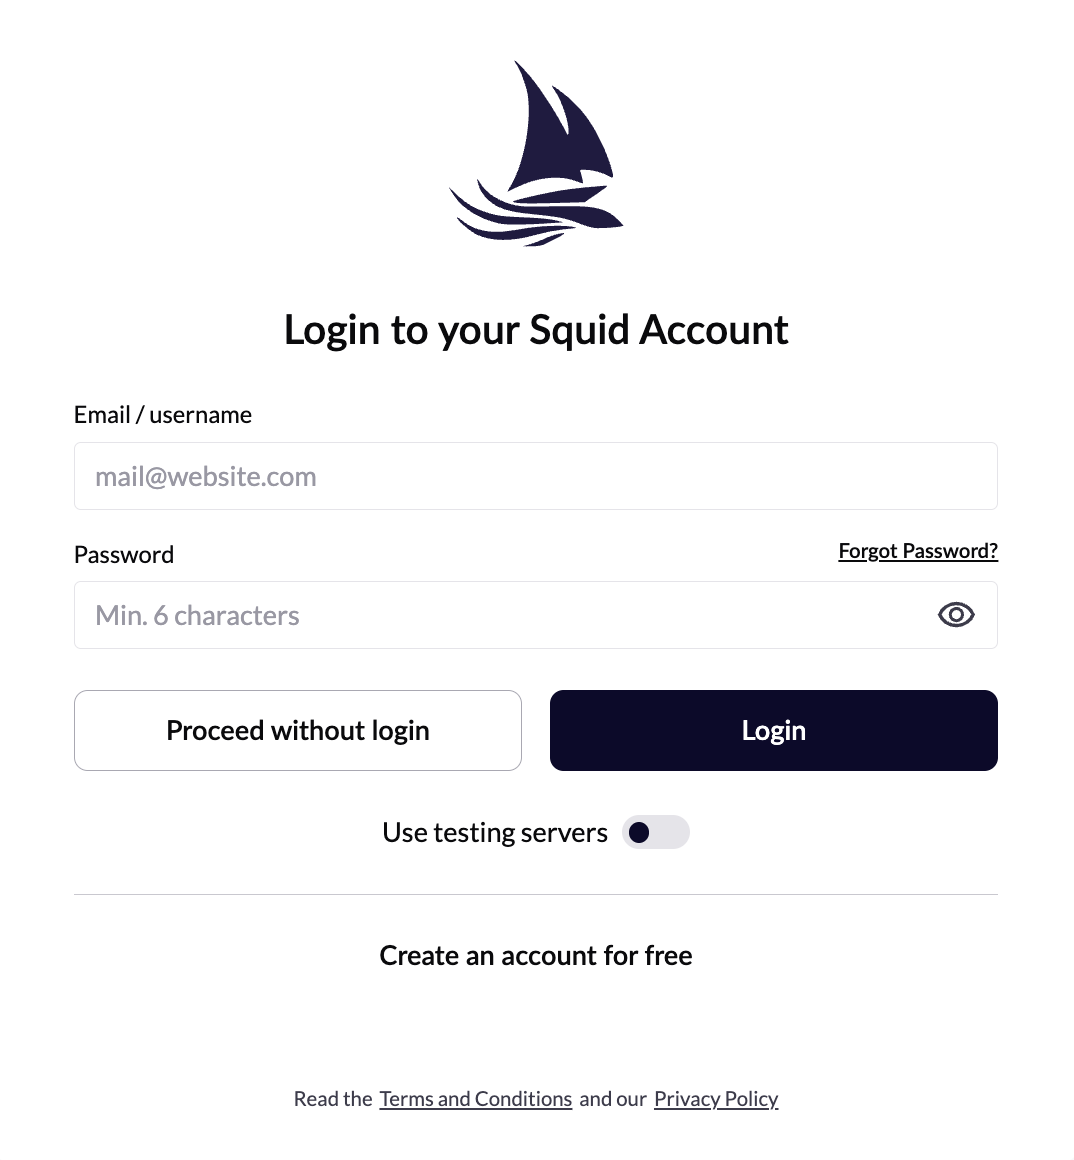
Squid uses a Squid account rather than a licence key — enter your email/username and password and select Login. From here you can also create an account, recover a forgotten password, or select Proceed without login to use Squid in anonymous mode (some features and subscription services need an account). Subscriptions are managed through the Squid website.
First-start onboarding
An introductory tutorial walks through the map, timeline and main controls the first time Squid opens.
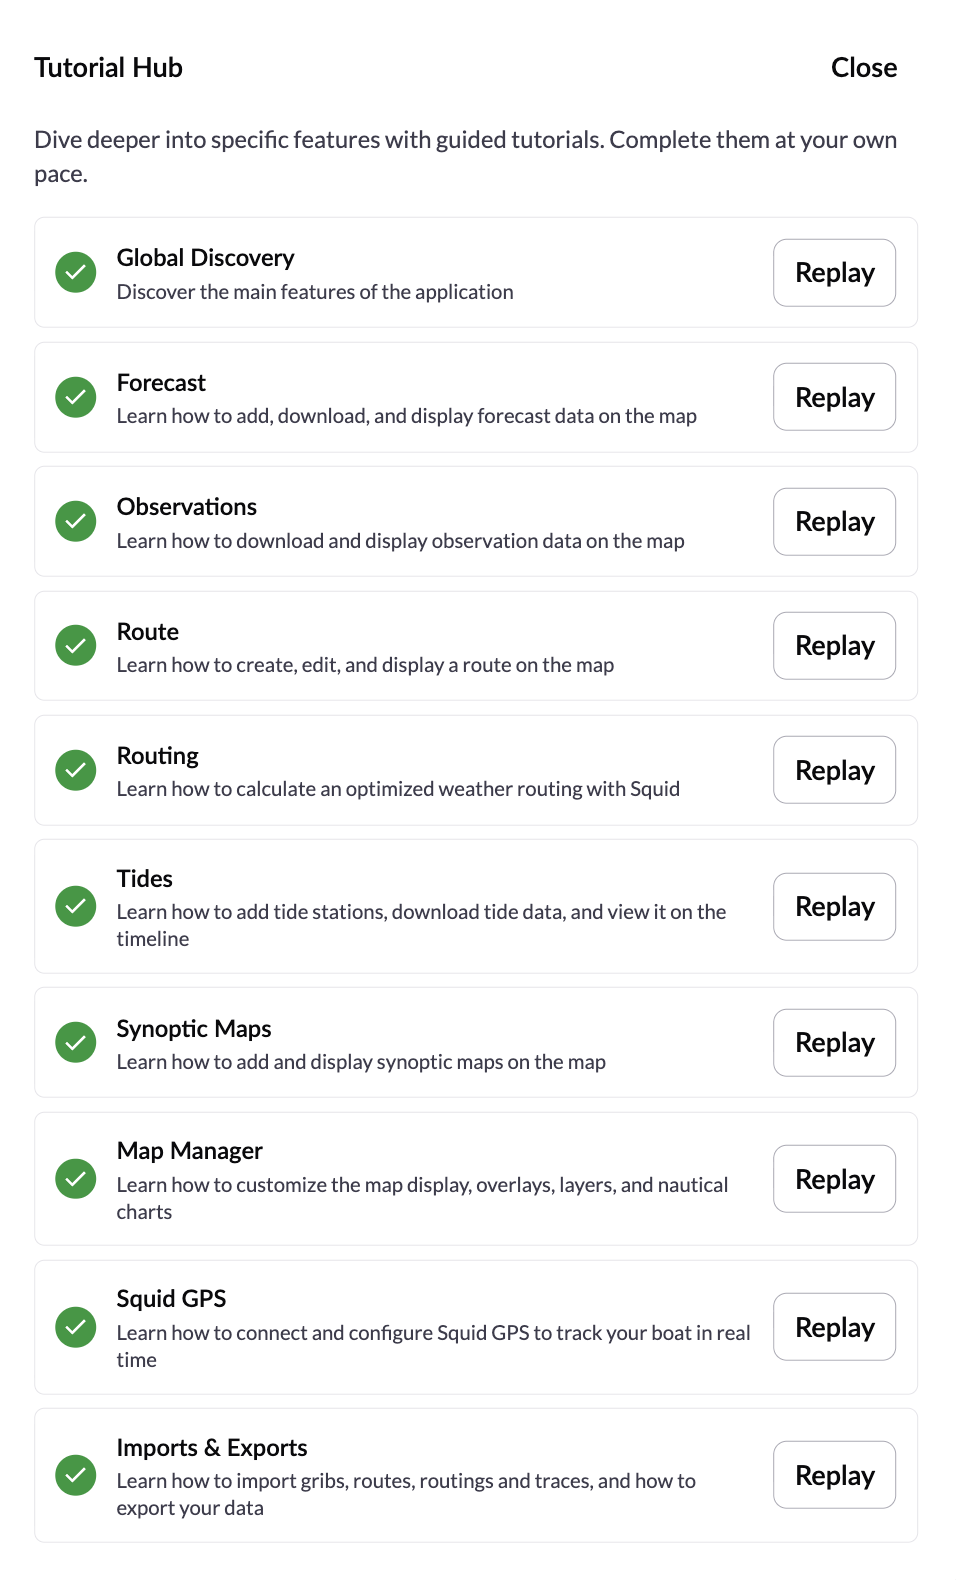
Tutorial Hub
Reached from Help → Tutorial Hub, it offers guided walkthroughs per feature — forecasts, satellite imagery, charts, routes, weather routing, tides, synoptic maps, GPS, and import/export — each tracked with a completion mark and a Replay option, so any of them can be revisited any time.
Logging out, switching users, uninstalling
Log out from the user menu — this doesn't remove local data, but signing back in needs a connection, so avoid it unnecessarily offshore. Before uninstalling, export or back up anything you want to keep: a standard uninstall can leave settings and downloaded data behind, and removing that separately deletes it permanently.
Application Overview
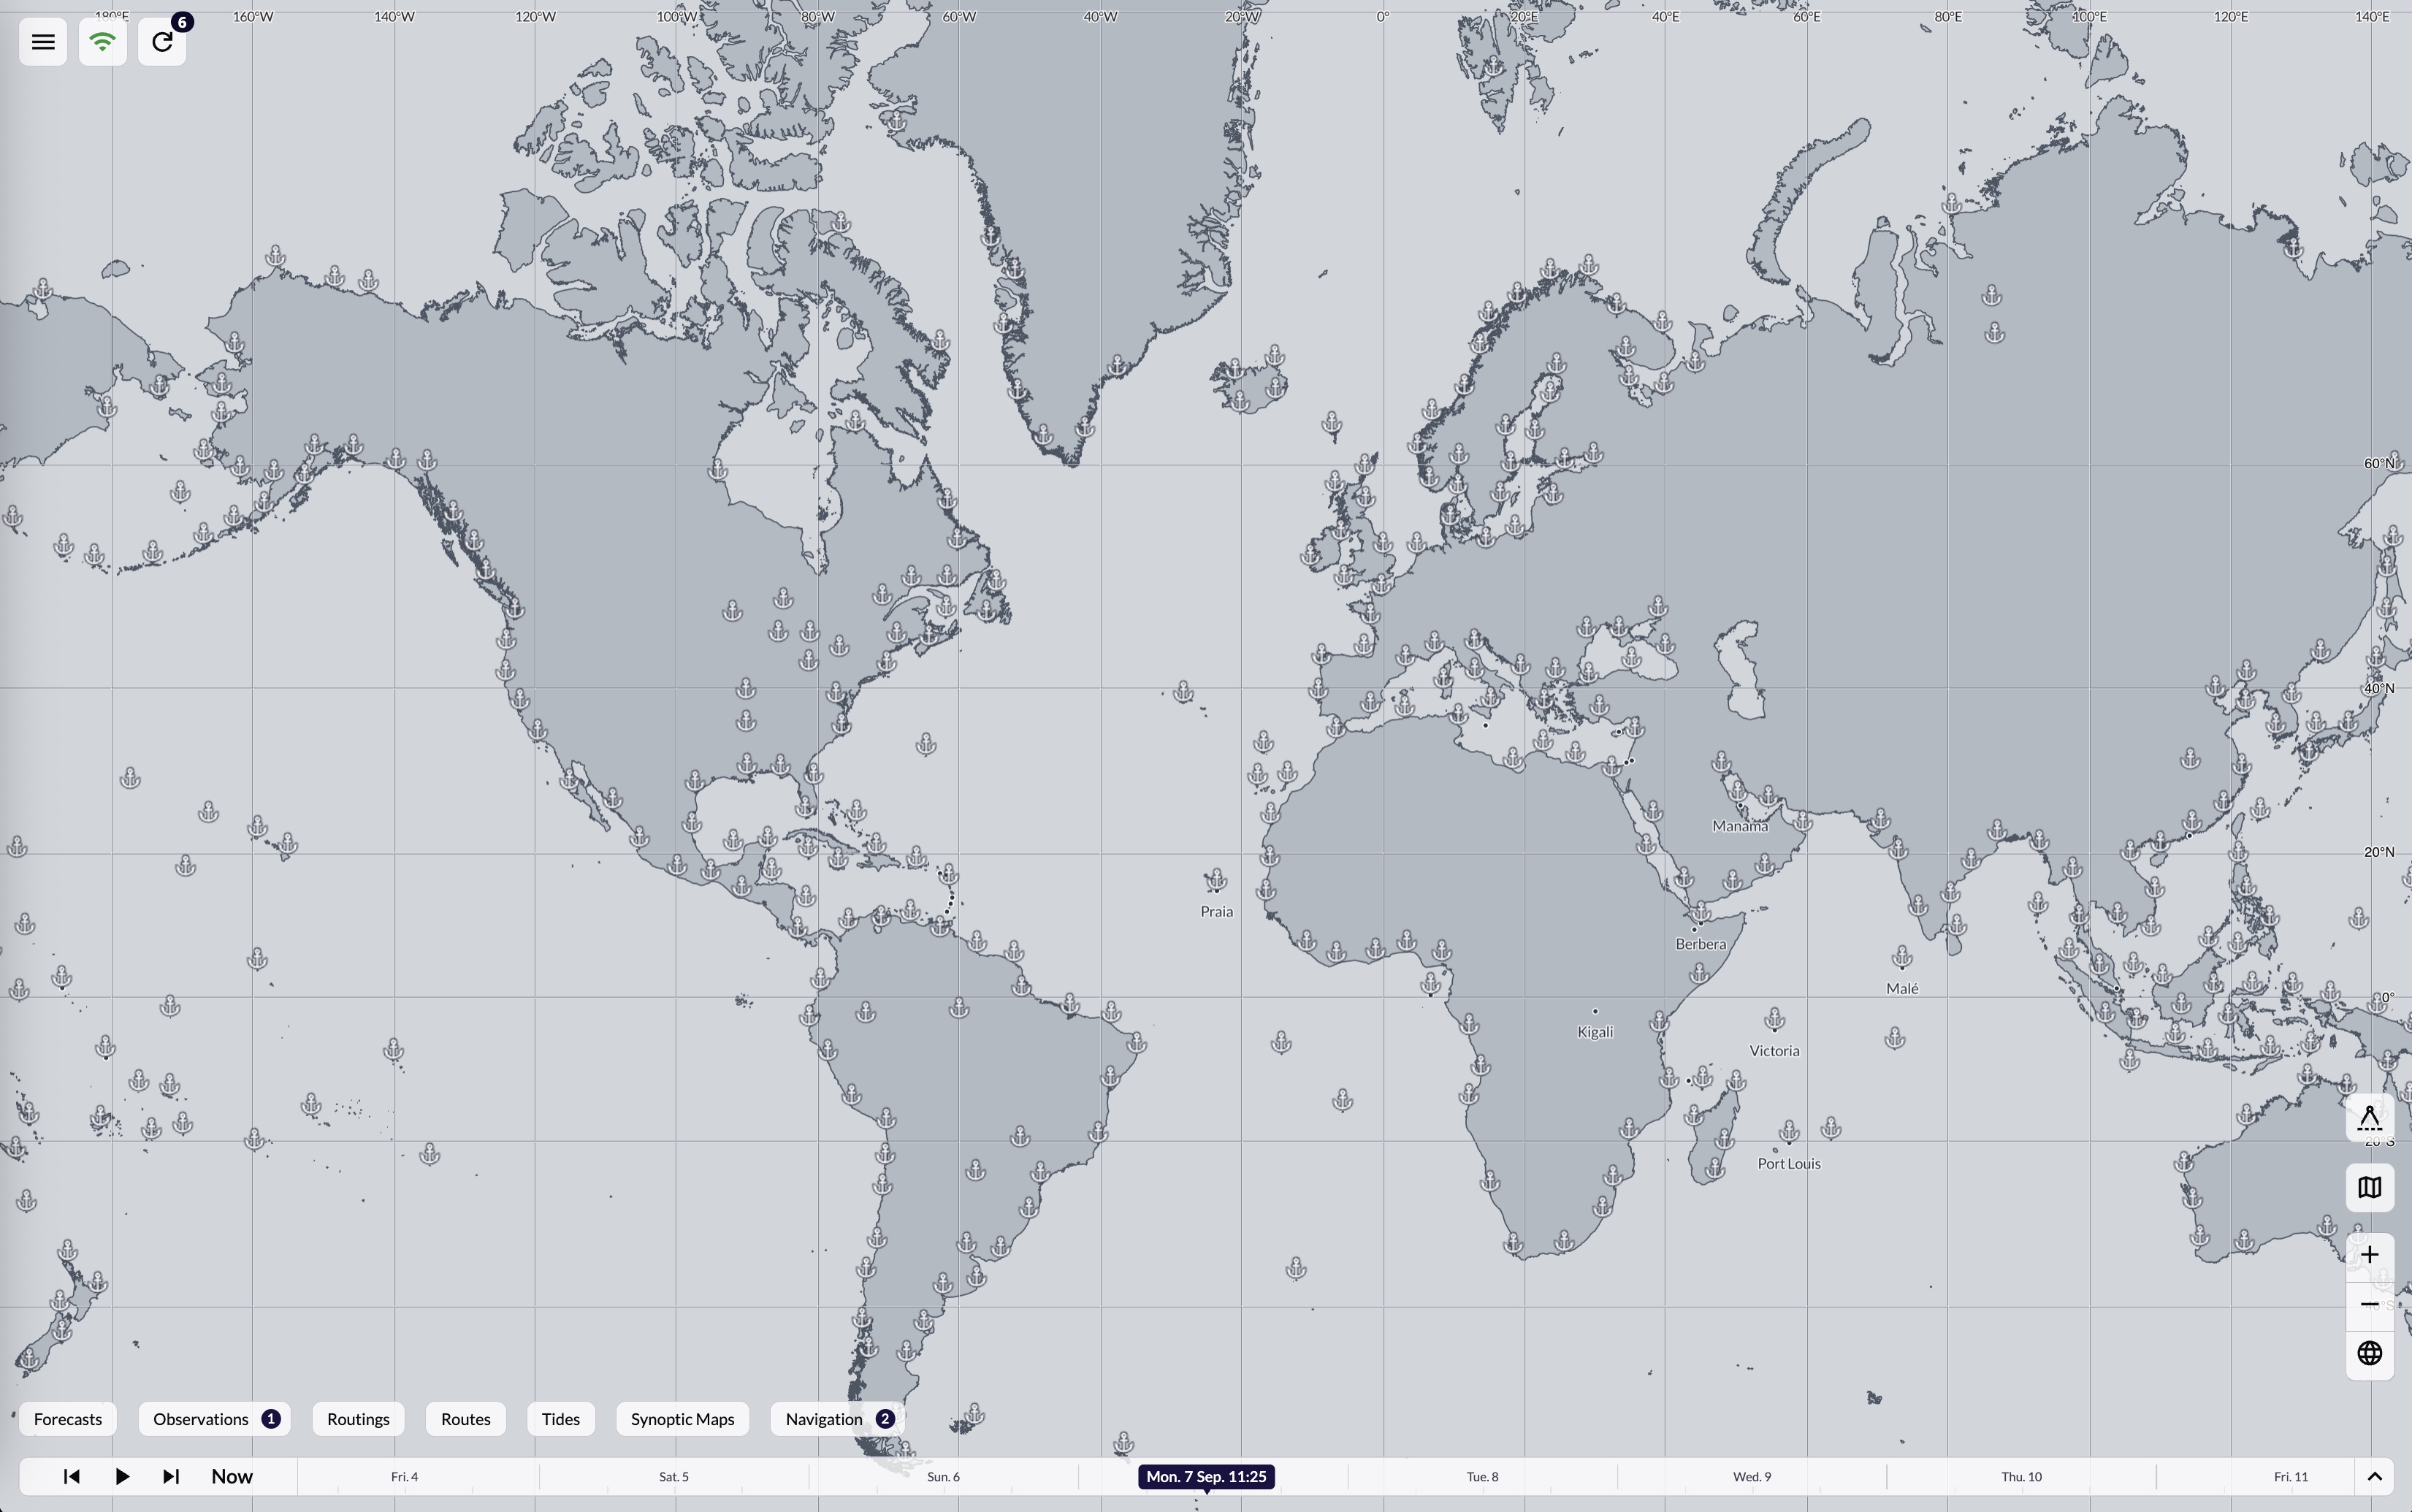
Squid is map-centred: most tools and information live around or over the map itself. Some controls only appear when relevant, and what's available can depend on your account.
Map area
The main workspace — forecasts, observations, routes, routings, tides, GPS and charts all live here. Drag to pan, wheel/trackpad/controls to zoom. Both Mercator and Globe views are supported. Selecting an object or location surfaces its values and details.
Main menu
Top-left. Switch Online/Offline, check for data updates, manage your account, open Settings, reach tutorials/support/diagnostics, import files, and create a backup.

Feature chips & carousel
Above the timeline: Forecasts, Observations, Routings, Routes, Tides, Synoptic Maps. Selecting one opens its carousel of current items — display, edit, refresh, inspect, export or delete from there.

Timeline
Controls the date/time shown across every compatible layer. See Timeline & Animation for the full reference.
Map controls
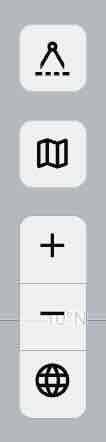
Right-hand side: zoom / world view, map options (projection, overlays), distance measurement, centre-on-GPS, and Iridium status.
Weather probe
Point-in-place detail for the selected position and time — wind, temperature, current, waves, pressure and more, in your chosen units.
A colour legend appears automatically for any layer using a colour scale, and updates with the active variable and your units. The Request Hub handles forecast/observation downloads — open it from the refresh indicator or a feature's Add button; a request is a product, its variables, an area and a time period.
Notifications cover downloads, connection problems, auth errors, routing errors and GPS/Iridium status — open the Activity Log for detail, or Help for support and diagnostics if something won't resolve.
Themes

Five interface themes are available: Light for daylight, Dark for low light, Night for very dark navigation environments where preserving night vision matters, plus Retro and Legacy for alternative visual styles. Choose the theme that makes the map and weather data easiest to read for your conditions. Interface language and UI scale are set from Settings → Display.
Working with the Map
Pan by dragging; zoom with the wheel, a trackpad gesture, or the +/− controls; in Globe mode, drag to rotate the Earth. All of this is also reachable by keyboard — see Keyboard & Mouse Controls.
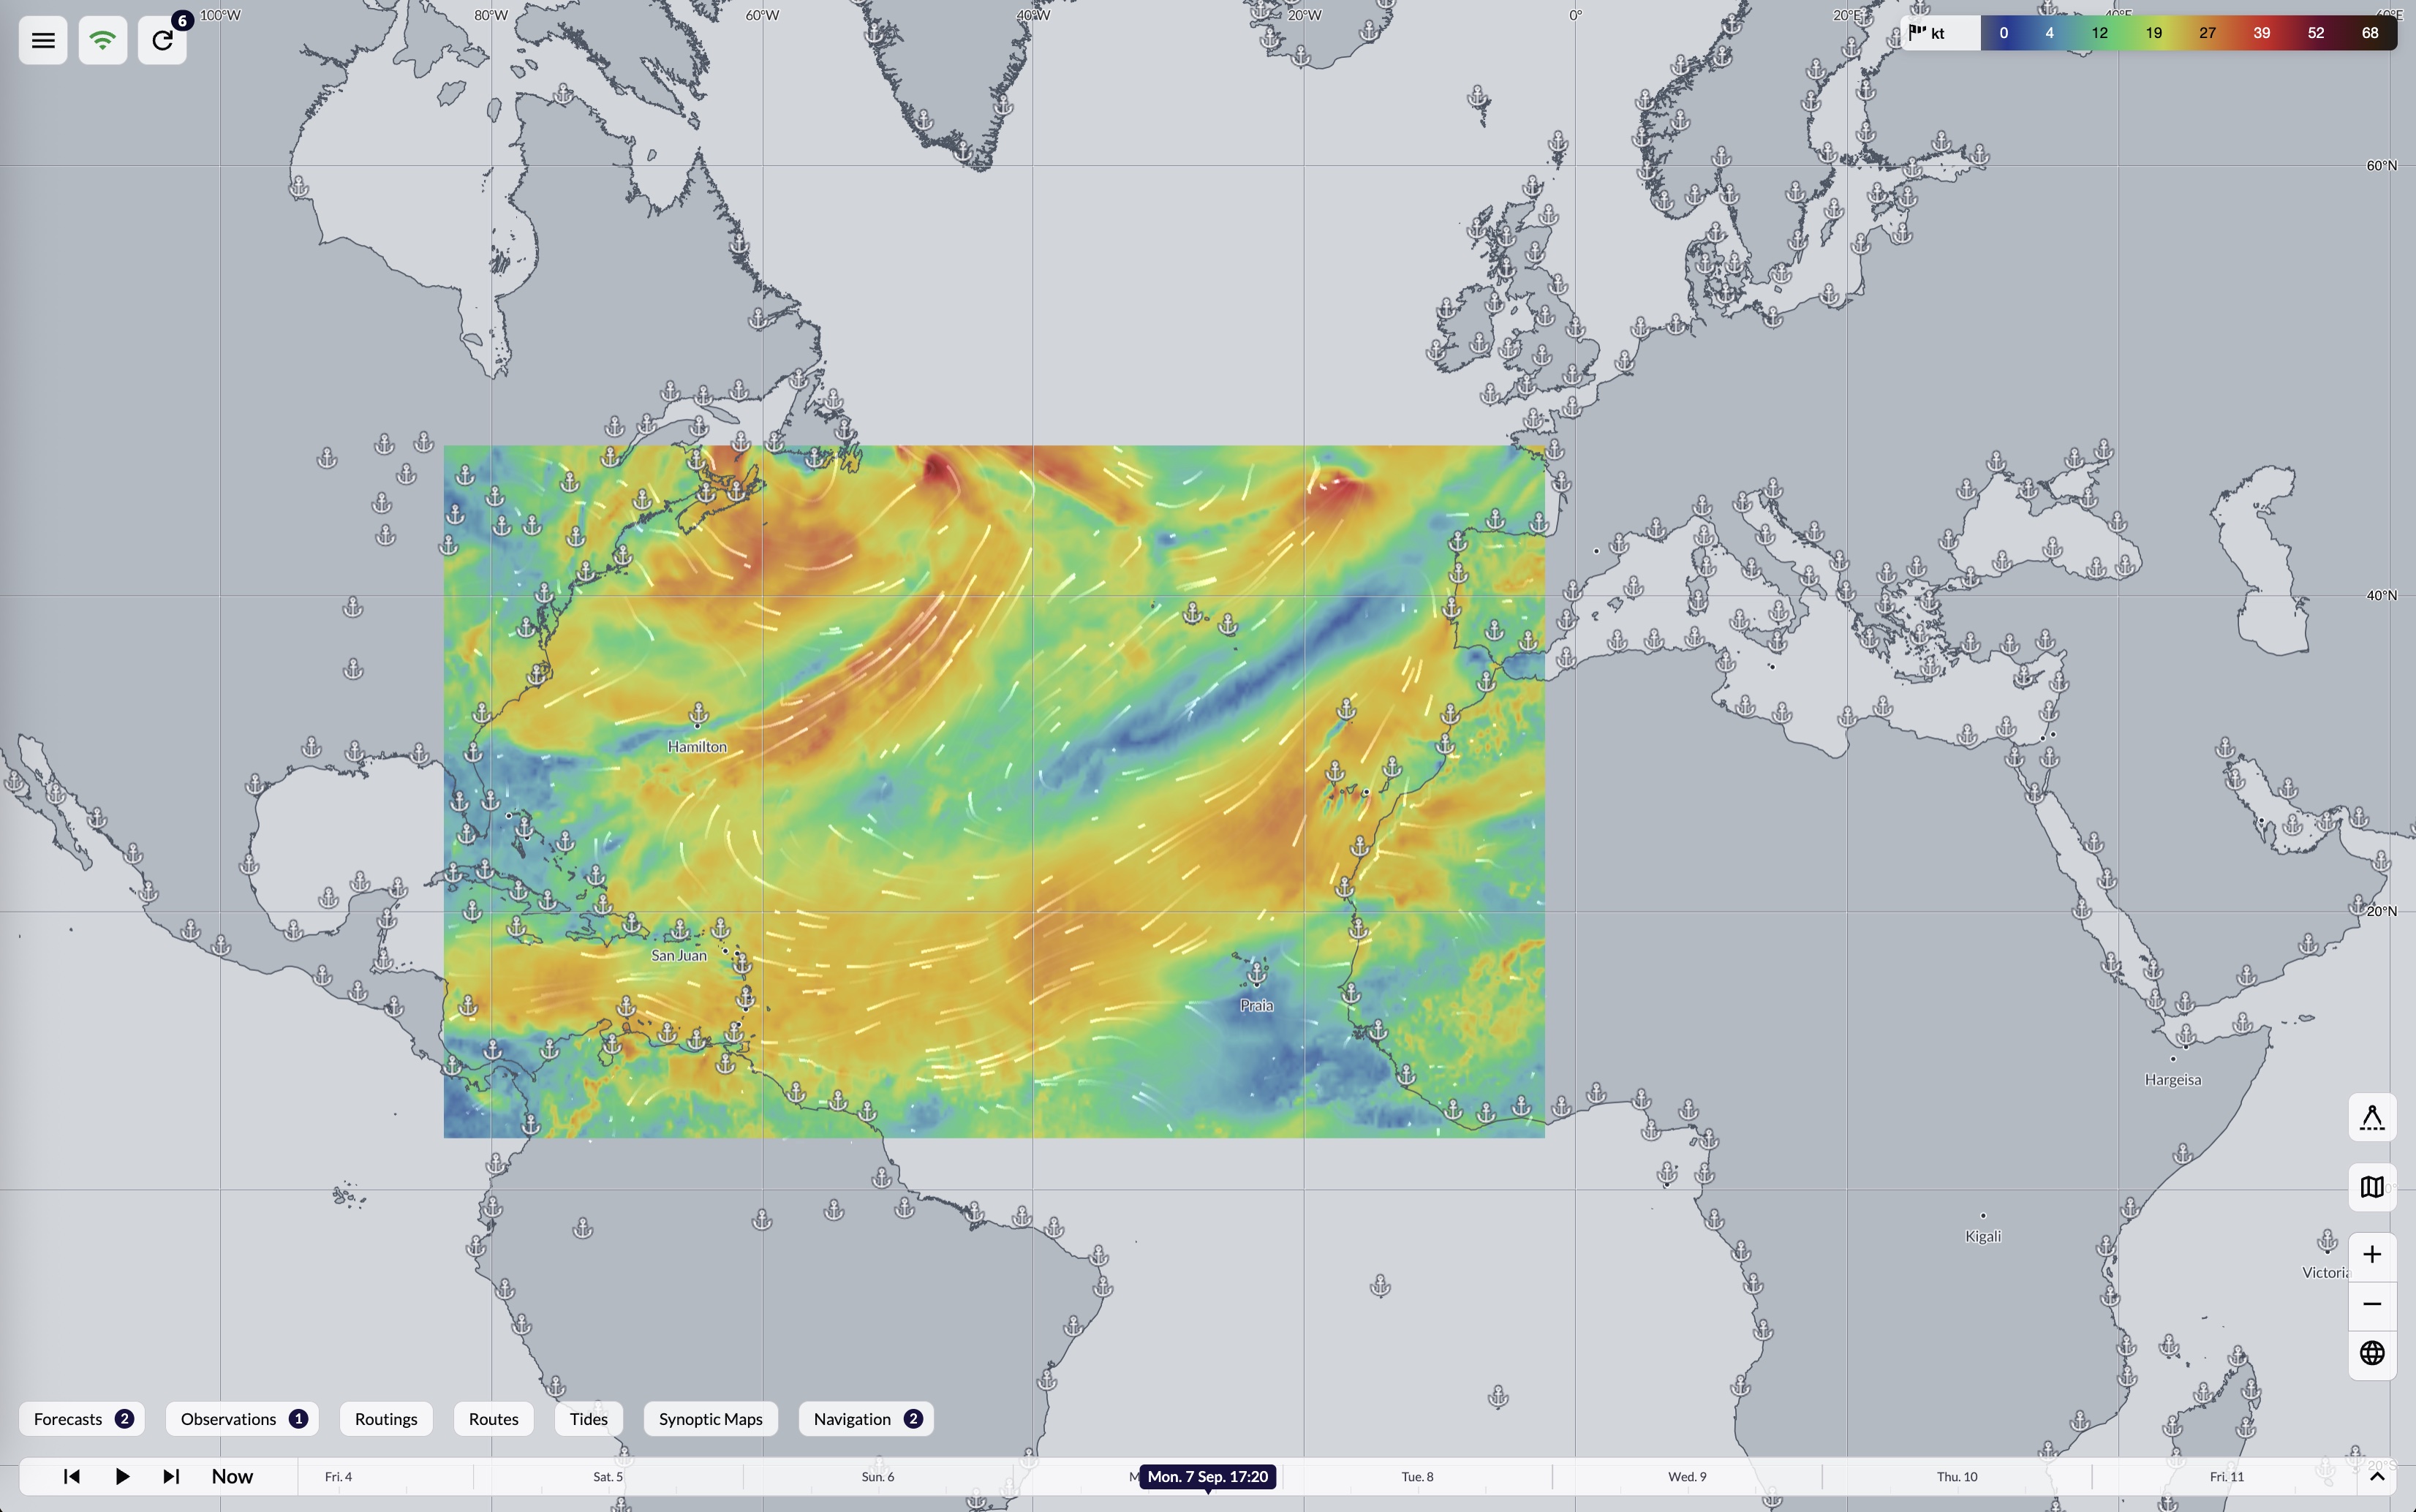
Mercator
The conventional flat projection — best for regional analysis, route creation, distance measurement and charts. Distortion increases toward the poles.
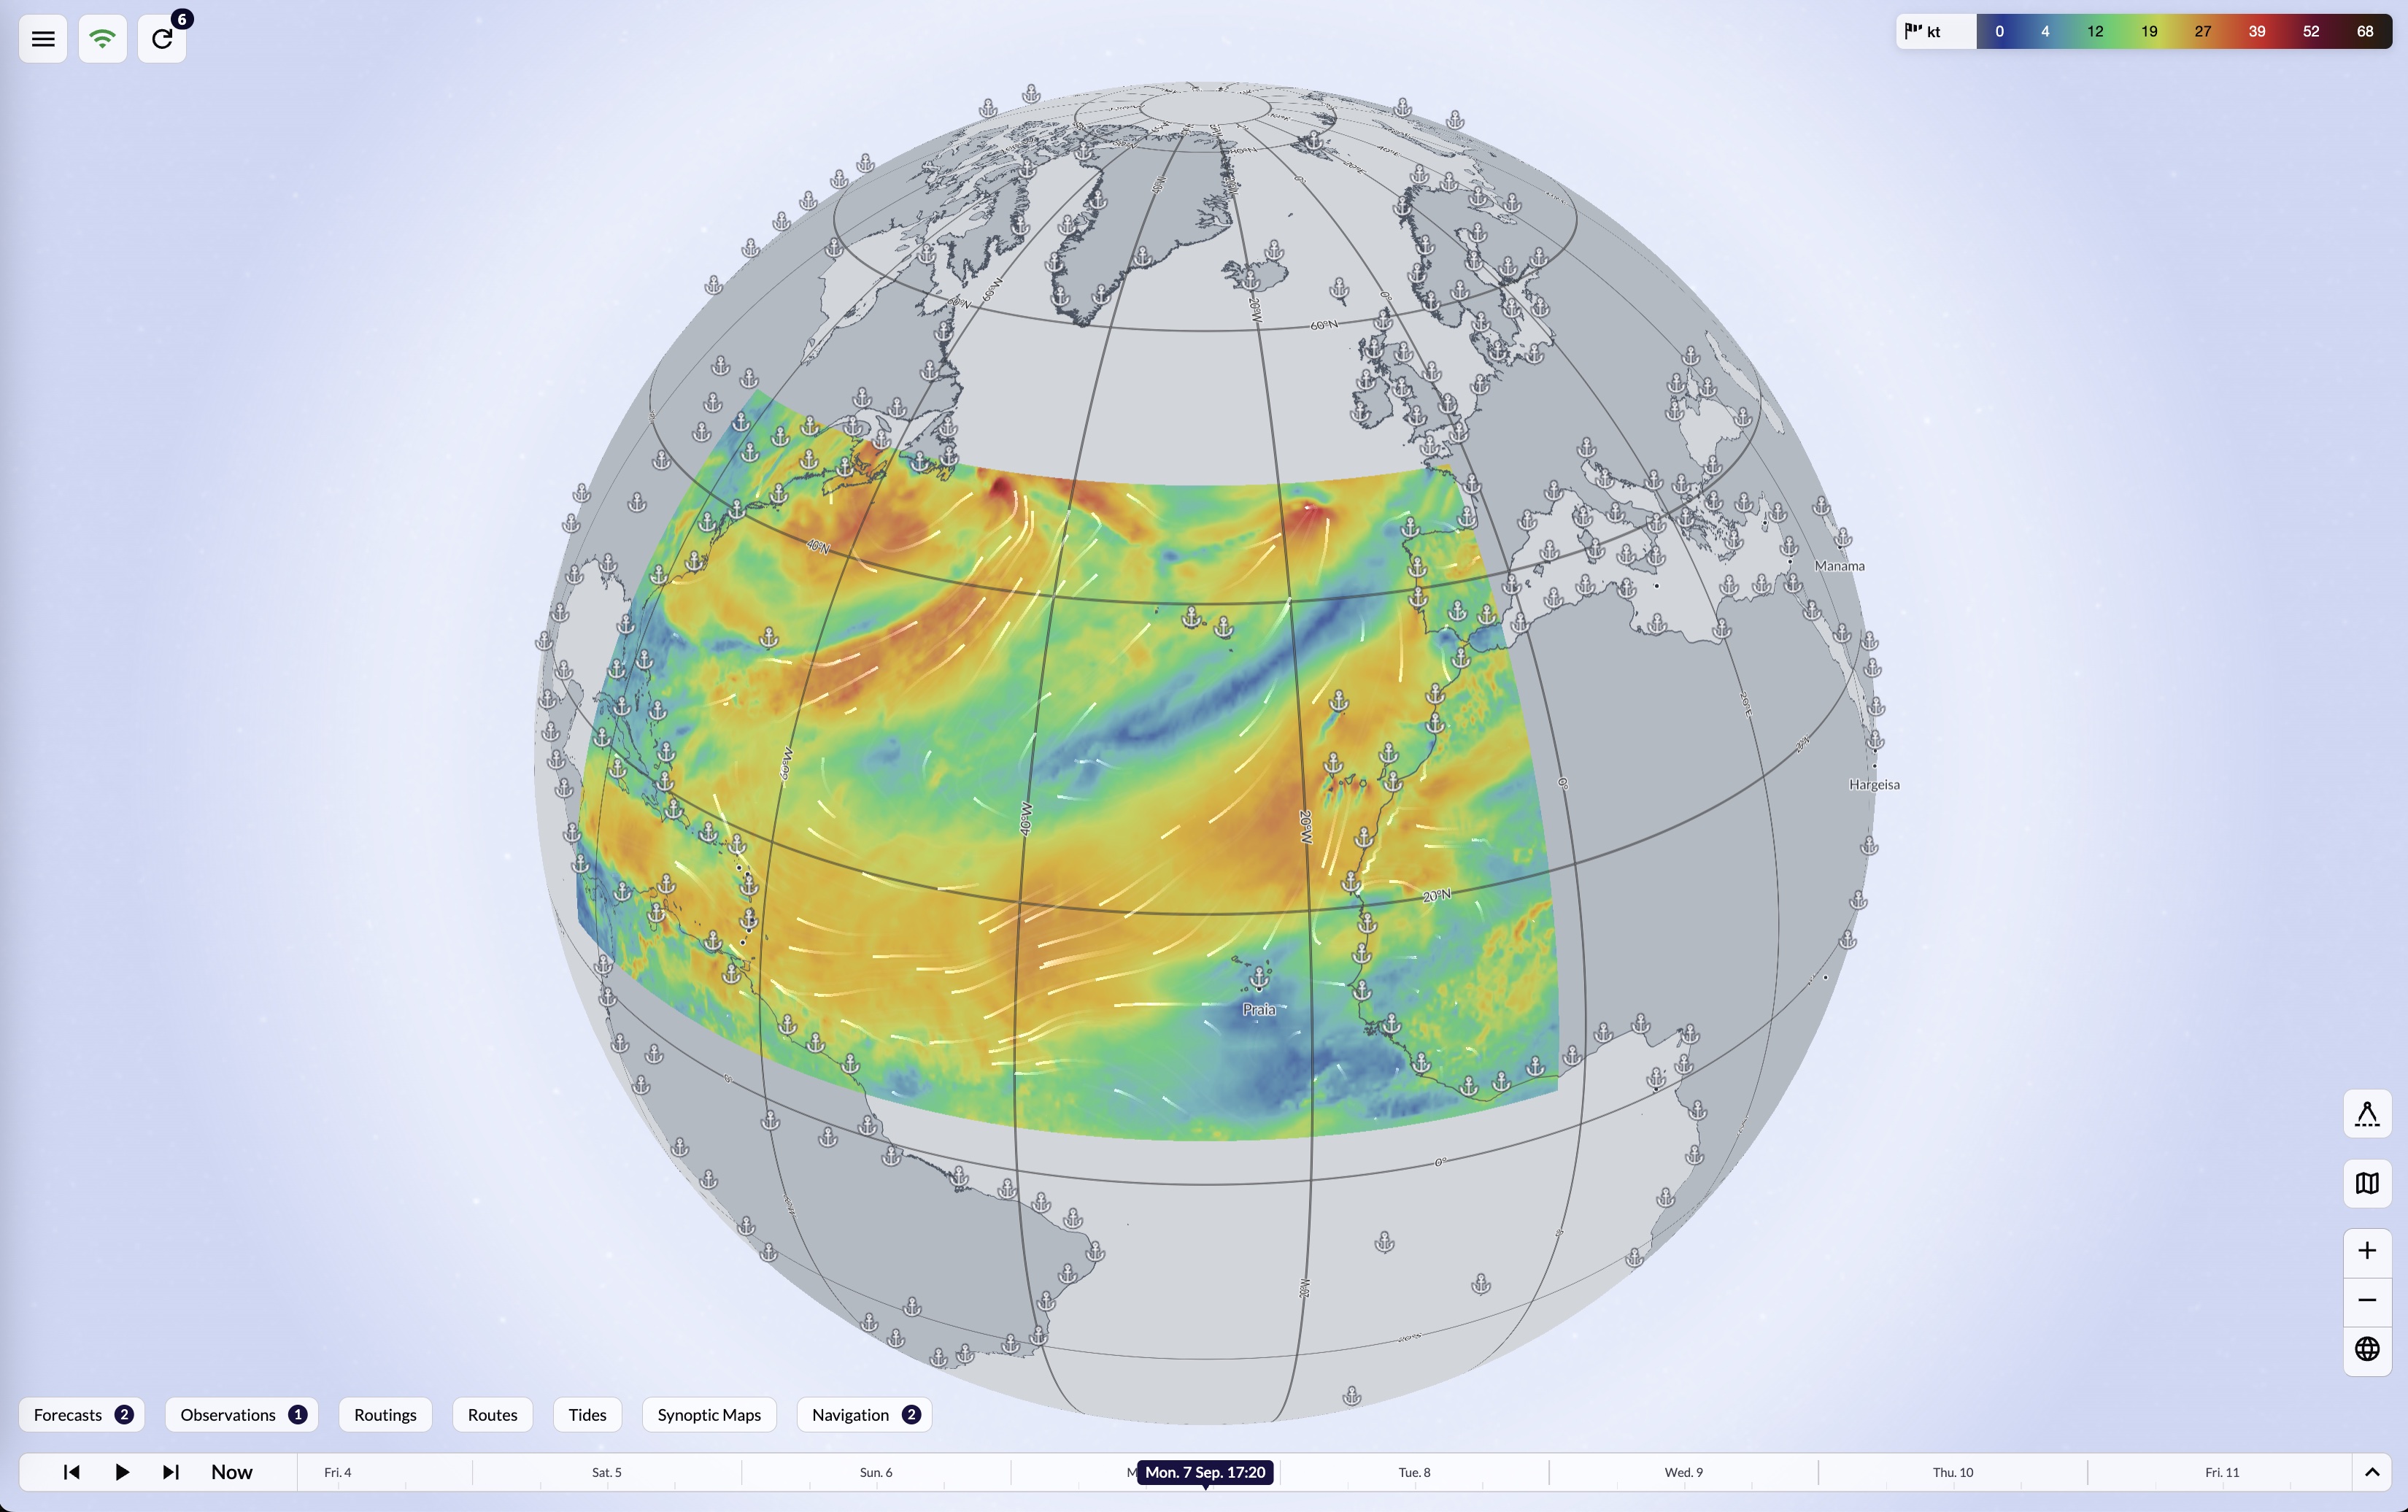
Globe
A three-dimensional Earth — best for large-scale routes, polar regions, global coverage, and routes crossing the date line. Switching projection changes only the presentation, never your data.
When Squid has a valid GPS/NMEA position, a My location button centres the map on the vessel; with position-following active the map tracks the boat automatically until you drag it manually.
Reading weather at a point
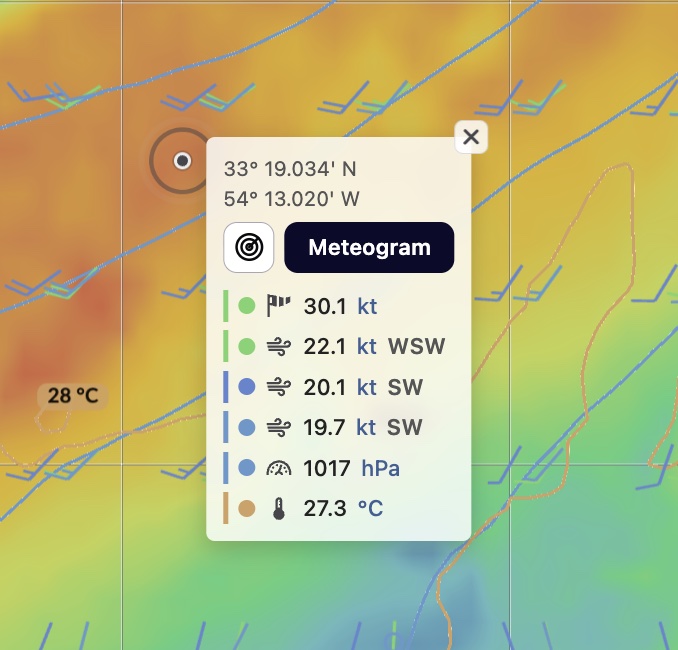
Display the forecast and variables you want, pick a time on the timeline, then right-click the map to open the weather probe — moving it or the timeline updates the reading live. Where available, open a Meteogram from the probe to see conditions at that point evolve over time, compared across models.
Direction conventions differ by variable: wind direction is where it's coming from; current direction is where the water is going to. See Appendix B.
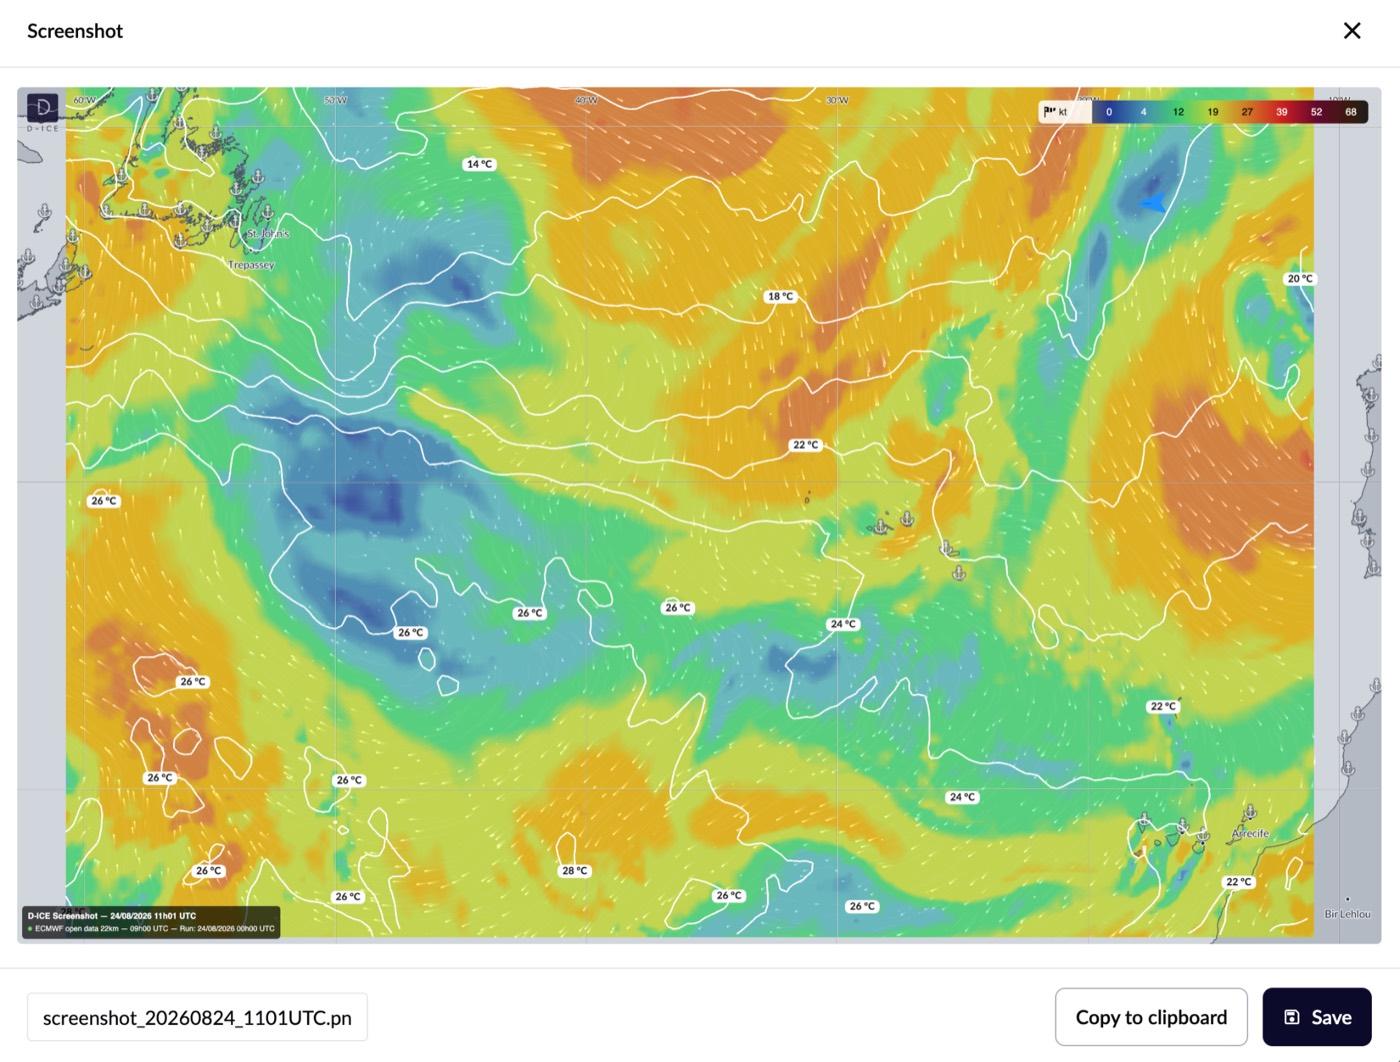
Screenshots
Prepare the view (area, time, layers), then press Ctrl/Cmd+P. The capture includes everything currently visible — weather layers, routes, routings — and the preview lets you rename it before copying to the clipboard or saving as an image.
Map Options and Cartography
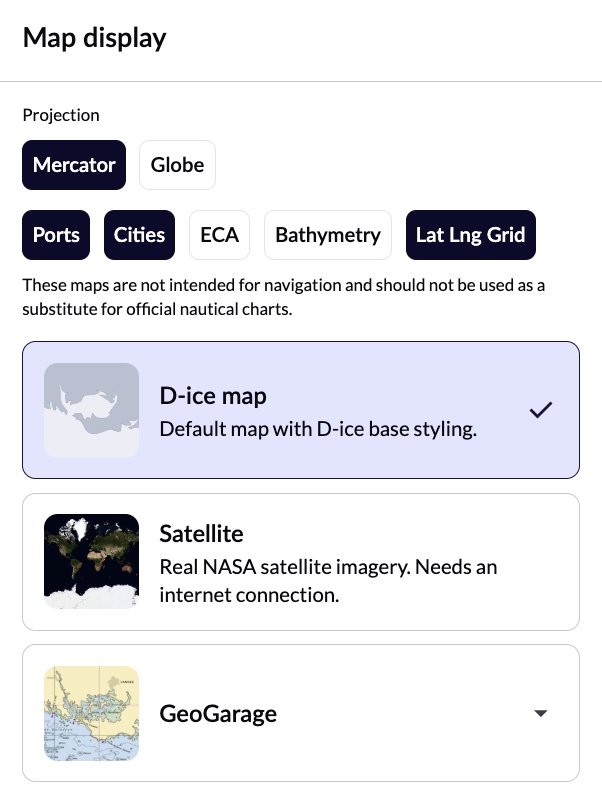
Open Map options from the right-hand controls to switch projection, toggle reference overlays, and choose the base map or nautical chart — changes apply immediately.
- Ports & cities
- ECA zones
- Bathymetry
- Lat/long grid
- D-ICE base map
- GeoGarage charts
- Offline charts
Toggle overlays on or off independently and combine as many as you need — though a clearer map, showing only what the current task needs, is usually easier to read. The D-ICE base map is always available offline, for orientation and analysis rather than as a substitute for an approved chart; the same caveat applies to the ECA and bathymetry overlays.
GeoGarage nautical charts
Sign in with your GeoGarage account from Map options to display supported professional chart products directly on the map, with Squid data layered over them. Availability depends on your GeoGarage subscription. Only one chart layer displays at a time.
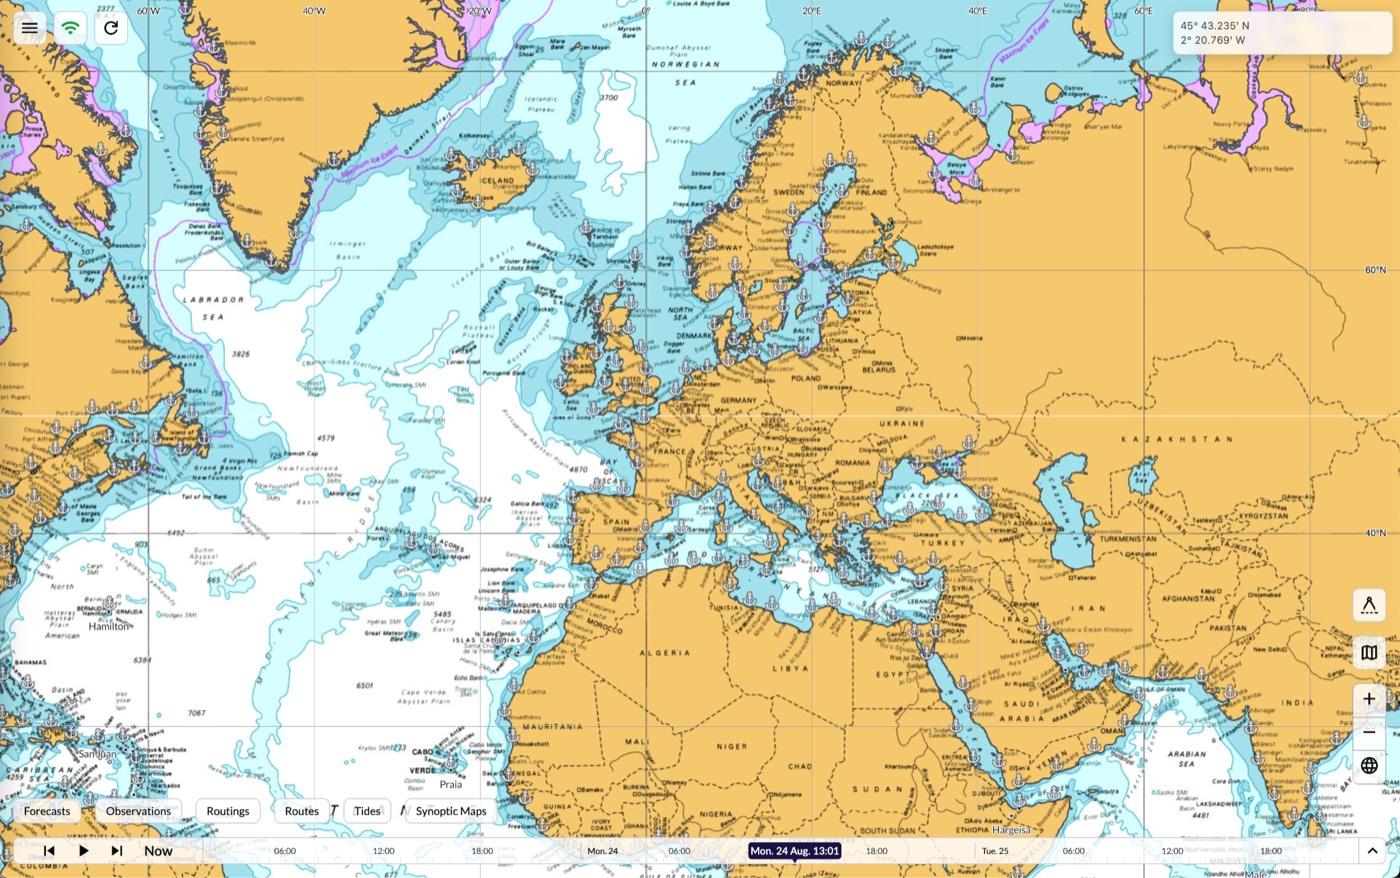
Offline charts
Download a GeoGarage chart area in advance: find it in Map options, select its download action, choose the area, and confirm — Squid prepares, verifies and installs it, after which it's available without a connection. In Offline mode, a downloaded version of the active chart is used automatically when one exists; otherwise the D-ICE base map is shown. Remove downloaded charts from the GeoGarage panel when no longer needed.
If a map or chart won't display
- Confirm the correct map/chart is selected, and that you're in the right Online/Offline mode for it.
- Check your connection for online charts, and that your position is inside the chart's coverage.
- Zoom, switch Mercator/Globe, or toggle the layer off and on.
Still stuck? See Troubleshooting.
Managing Data
Forecasts and observations both flow through the same place — the Request Hub — so this pattern is worth learning once. Every later section (Forecasts, Observations, Synoptic Maps, Tides) links back here instead of repeating it.
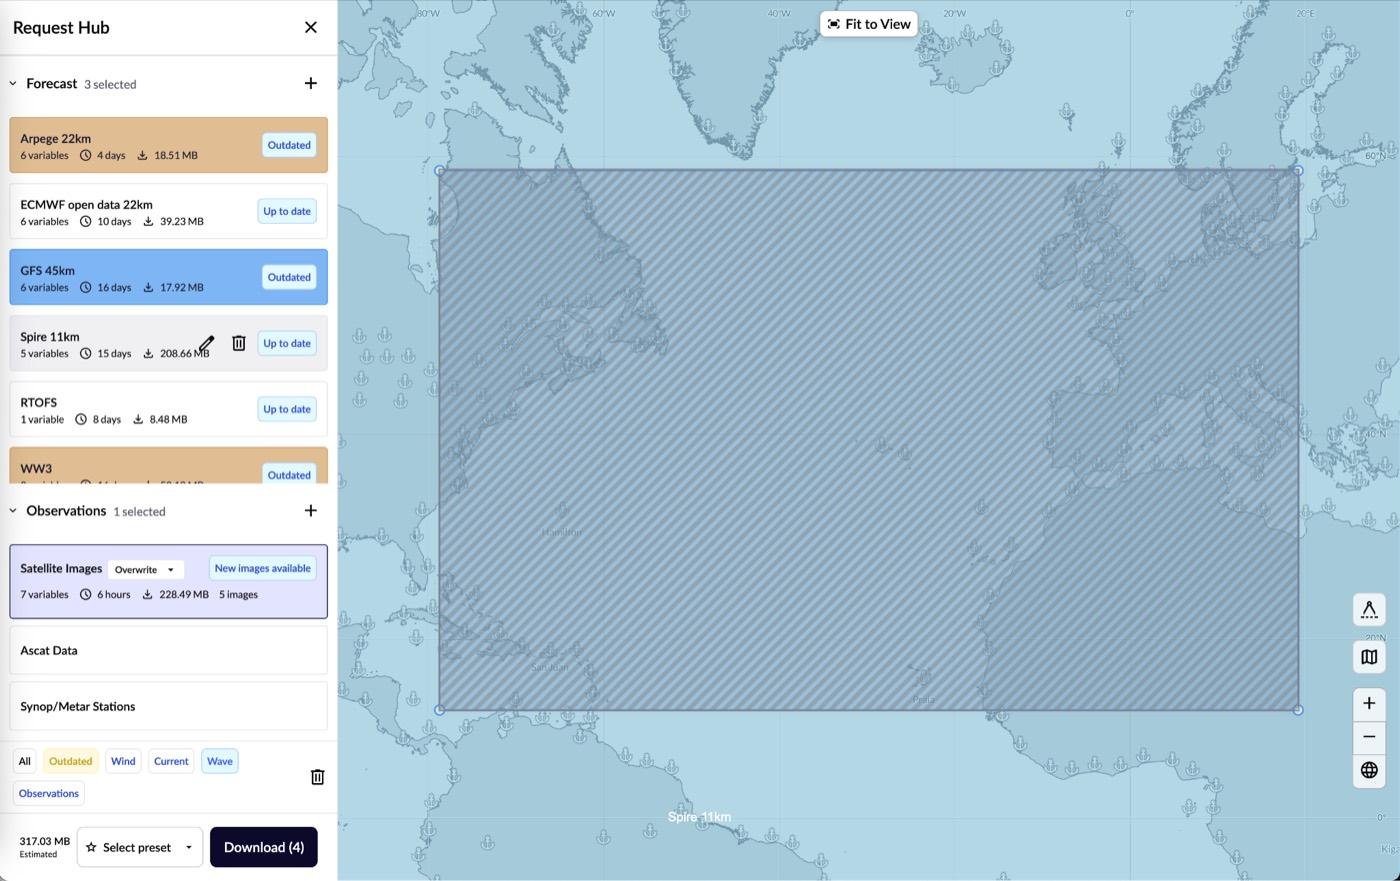
The request basket
Anything added to the Request Hub sits in the basket, in one of four states: in the basket (configured), selected (included in the next download), downloaded (stored locally), or displayed (visible on the map). Quick-selection controls let you select everything, just what's outdated, or a specific data type at once. Estimated download size updates live as you adjust area, variables or time range.
- Select a geographic area. Adjust the rectangle to cover the region you need, with margin for routing alternatives. Bigger areas mean bigger, slower downloads — pick the smallest one that comfortably covers your plan.
- Select a time range. Forecast duration, time steps, variables, and model run where available. Satellite imagery and observations use their own recency-based time controls instead.
- Download. Squid downloads, extracts, verifies and processes the request; progress shows in the app. Completed data appears in its feature panel and on the timeline automatically.
Presets
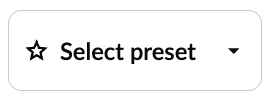
Save a frequent selection — a daily update, an offshore passage, a low-bandwidth request — as a preset. It saves the configuration, not the downloaded data itself.
Cancelling & retrying
Downloads generally can't be paused. Cancel an active request from its notification if one is available (you'll need to restart it); if a download fails, check you're Online, your connection (or Iridium) is up, your account covers the product, and you have enough storage and haven't asked for more than you need — then retry from the notification or Request Hub.
Updating & removing
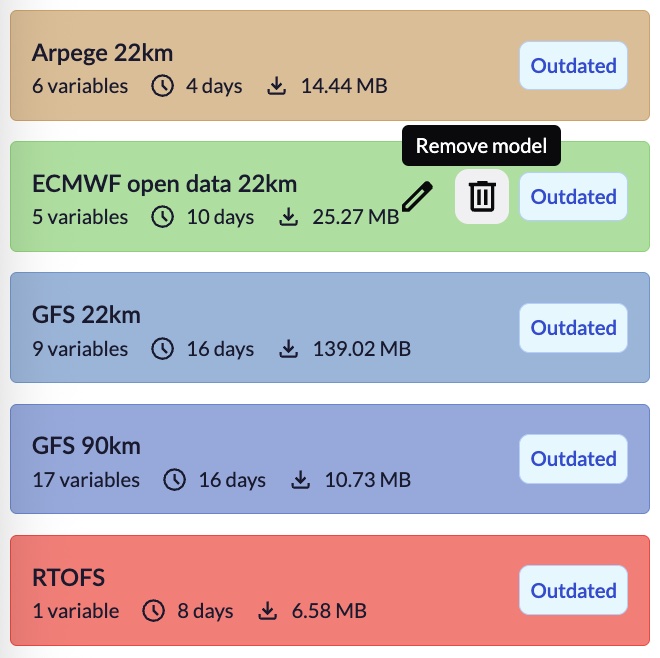
The refresh indicator flags newer data; use the Outdated filter in the Request Hub to find it quickly, and consider recalculating routings after an important refresh. To remove data: Clean basket drops products from the Hub but keeps downloaded files; Delete all removes both and can't be undone — routes, routings and traces are your own operational data and should be backed up before deleting anything.
Preparing to go offline? Jump straight to the offshore checklist.
Weather Forecasts
Squid gives access to multiple atmospheric, current and wave models — the catalogue depends on your subscription, location and current availability. Models differ in coverage, resolution, duration and variables; comparing a few when conditions are uncertain gives a better read than trusting one.
Global vs. regional
Global models cover huge areas, well suited to offshore passages and long-range planning. Regional models cover less ground at higher resolution — useful for coastal sailing, racing and local detail. Download a global model too for any passage that leaves a regional model's coverage.
Choosing resolution
Higher resolution means more detail but bigger, slower downloads; lower resolution suits large ocean areas, long range and limited bandwidth. Map zoom is unrelated — zooming in doesn't sharpen the forecast itself.
Available variables depend on the model: wind and gusts, pressure, temperature, precipitation and cloud, currents, wave and swell height/period/direction (full reference in Appendix A). Only download what you need — wind is required for weather routing, and currents/waves only matter if you want them to influence the calculation.
Adding a forecast
Open Forecasts → Add model, choose model/family, resolution, variables, period and area, review the estimated size, and download — see Managing Data for the shared download workflow. Once processed, it appears in the Forecasts carousel and its timestamps join the timeline.
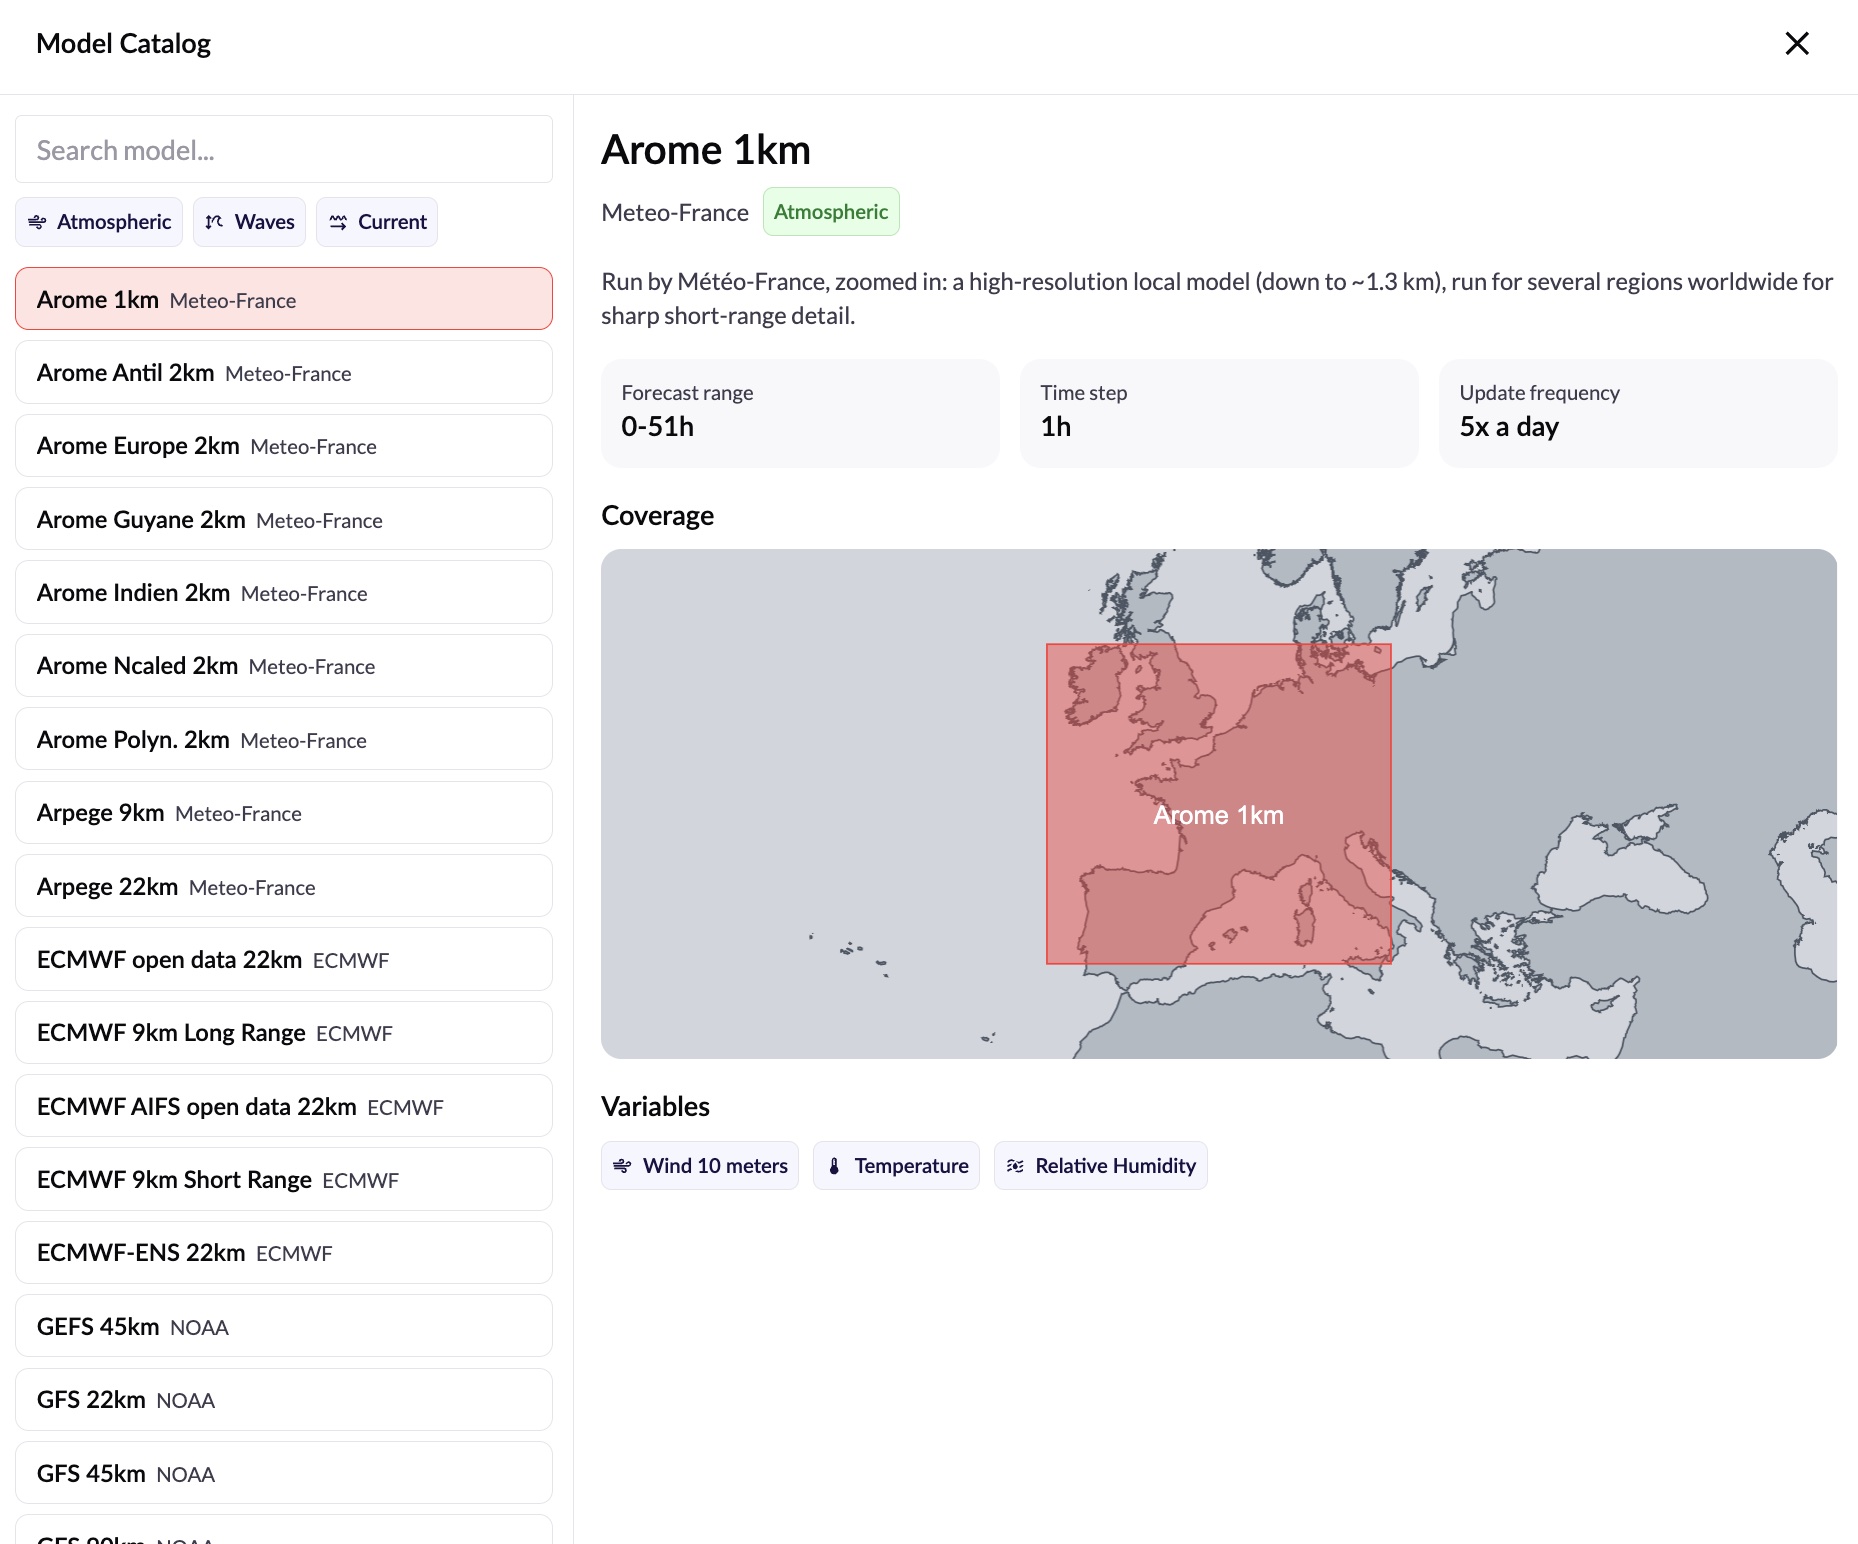
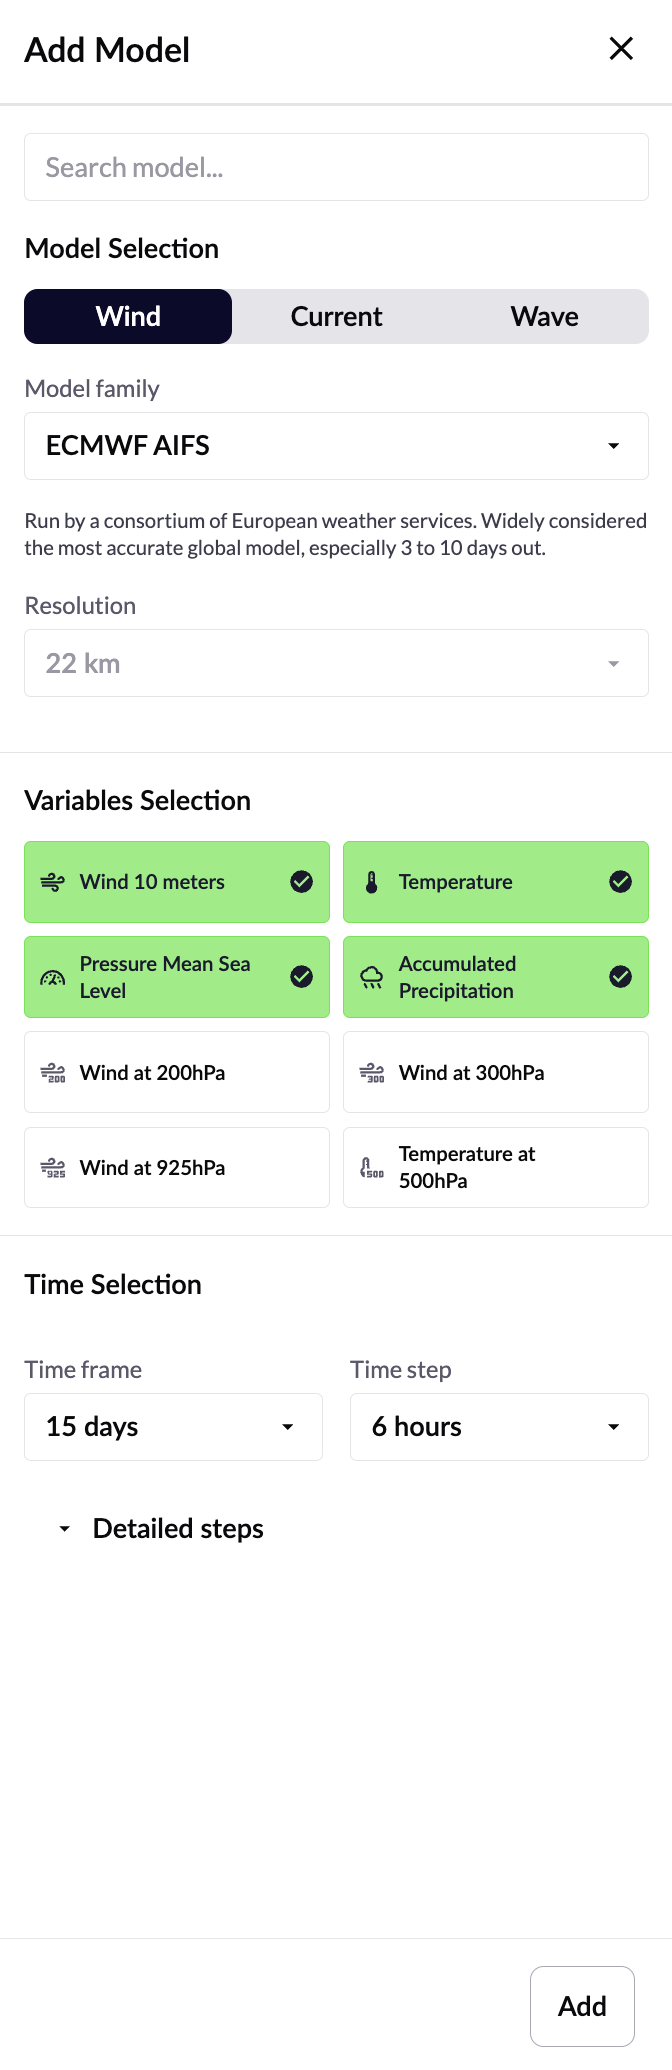
Add Model panel
After picking a model in the catalog, choose its resolution, tick the variables you want, set a time frame and time step, then confirm with Add to send it to the basket.
Representations
- Heatmaps
- Contours / isolines
- Arrows & barbs
- Particles / streamlines
- Labels
Several compatible representations can be combined — wind speed as a heatmap with barbs and pressure isolines, for example — but keep it simple enough to actually read. Always check the legend when switching variable or model: the same colour can mean very different values.
Comparing models
Display the same variable and timestamp from several models and switch between them, or use Compare Models to highlight differences directly on the map for compatible models. Disagreement between models signals uncertainty — but agreement doesn't guarantee correctness.
Remove a forecast you no longer need from Manage forecasts; this deletes its data, map layers and timeline entries (it can always be downloaded again). Check whether an important routing depends on it first.
Timeline and Animation
The timeline is the shared time control for everything time-based: forecasts, observations, tides, meteograms and routing information. A vertical cursor marks the selected moment; moving it updates every compatible layer at once.
Press Shift to expand or collapse it. Collapsed, you get navigation and animation controls in minimal space; expanded, four tabs — Data Display (one row per forecast/observation source), Tides, Meteogram, and Routes.

Moving through time
Click anywhere on the timeline to jump the cursor there, or drag it to scrub continuously; drag the timeline itself to pan the visible window without changing scale. Clicking a data mark on a source's row jumps straight to that timestamp.
Now & follow mode
Select Now to recentre on the current time and enter follow mode — the cursor advances automatically once per second, provided the current time falls inside your loaded data (otherwise Now does nothing). Any manual interaction — stepping, dragging, playing — turns follow mode off again.
Play, step, and day-jump
Play animates through the timestamps your data actually has (not fixed clock intervals), stopping automatically at the end — pause and resume any time. Step forward/back moves to the next or previous timestamp with real data; day forward/back always moves exactly 24 hours, independent of what data exists.
| Action | Shortcut |
|---|---|
| Open / close timeline | Shift |
| Play / Pause | Space |
| Previous / Next step | ← / → |
| Previous / Next day | Ctrl/Cmd+← / → |
| Zoom in / out | ↑ / ↓ |
Full shortcut reference, all controls: Keyboard & Mouse Controls.
Data coverage
On the Data Display tab, each row is one source with marks at every timestamp it has data for — a fast way to see where models overlap, where one runs longer than another, or where a feed has gaps. Hidden-from-map sources can still show their row here, so you can check availability without turning them back on.
Out of range? An arrow at a row's edge points toward that source's data — click it to jump there. When a whole source's data sits outside the current view, a compact date-range label rides along with the arrow.
Synoptic maps are different
Each synoptic map is a static, dated snapshot, not a scrubbable dataset — it's browsed with its own controls, and the timeline's keyboard shortcuts are disabled while one is open so the two systems don't fight over the same keys. Details in Synoptic Maps.
Observations and Satellite Data
Real, measured or remotely-sensed conditions, displayed alongside forecasts for direct comparison. Three independent products — download, display, update or remove one without touching the others.
Satellite Images
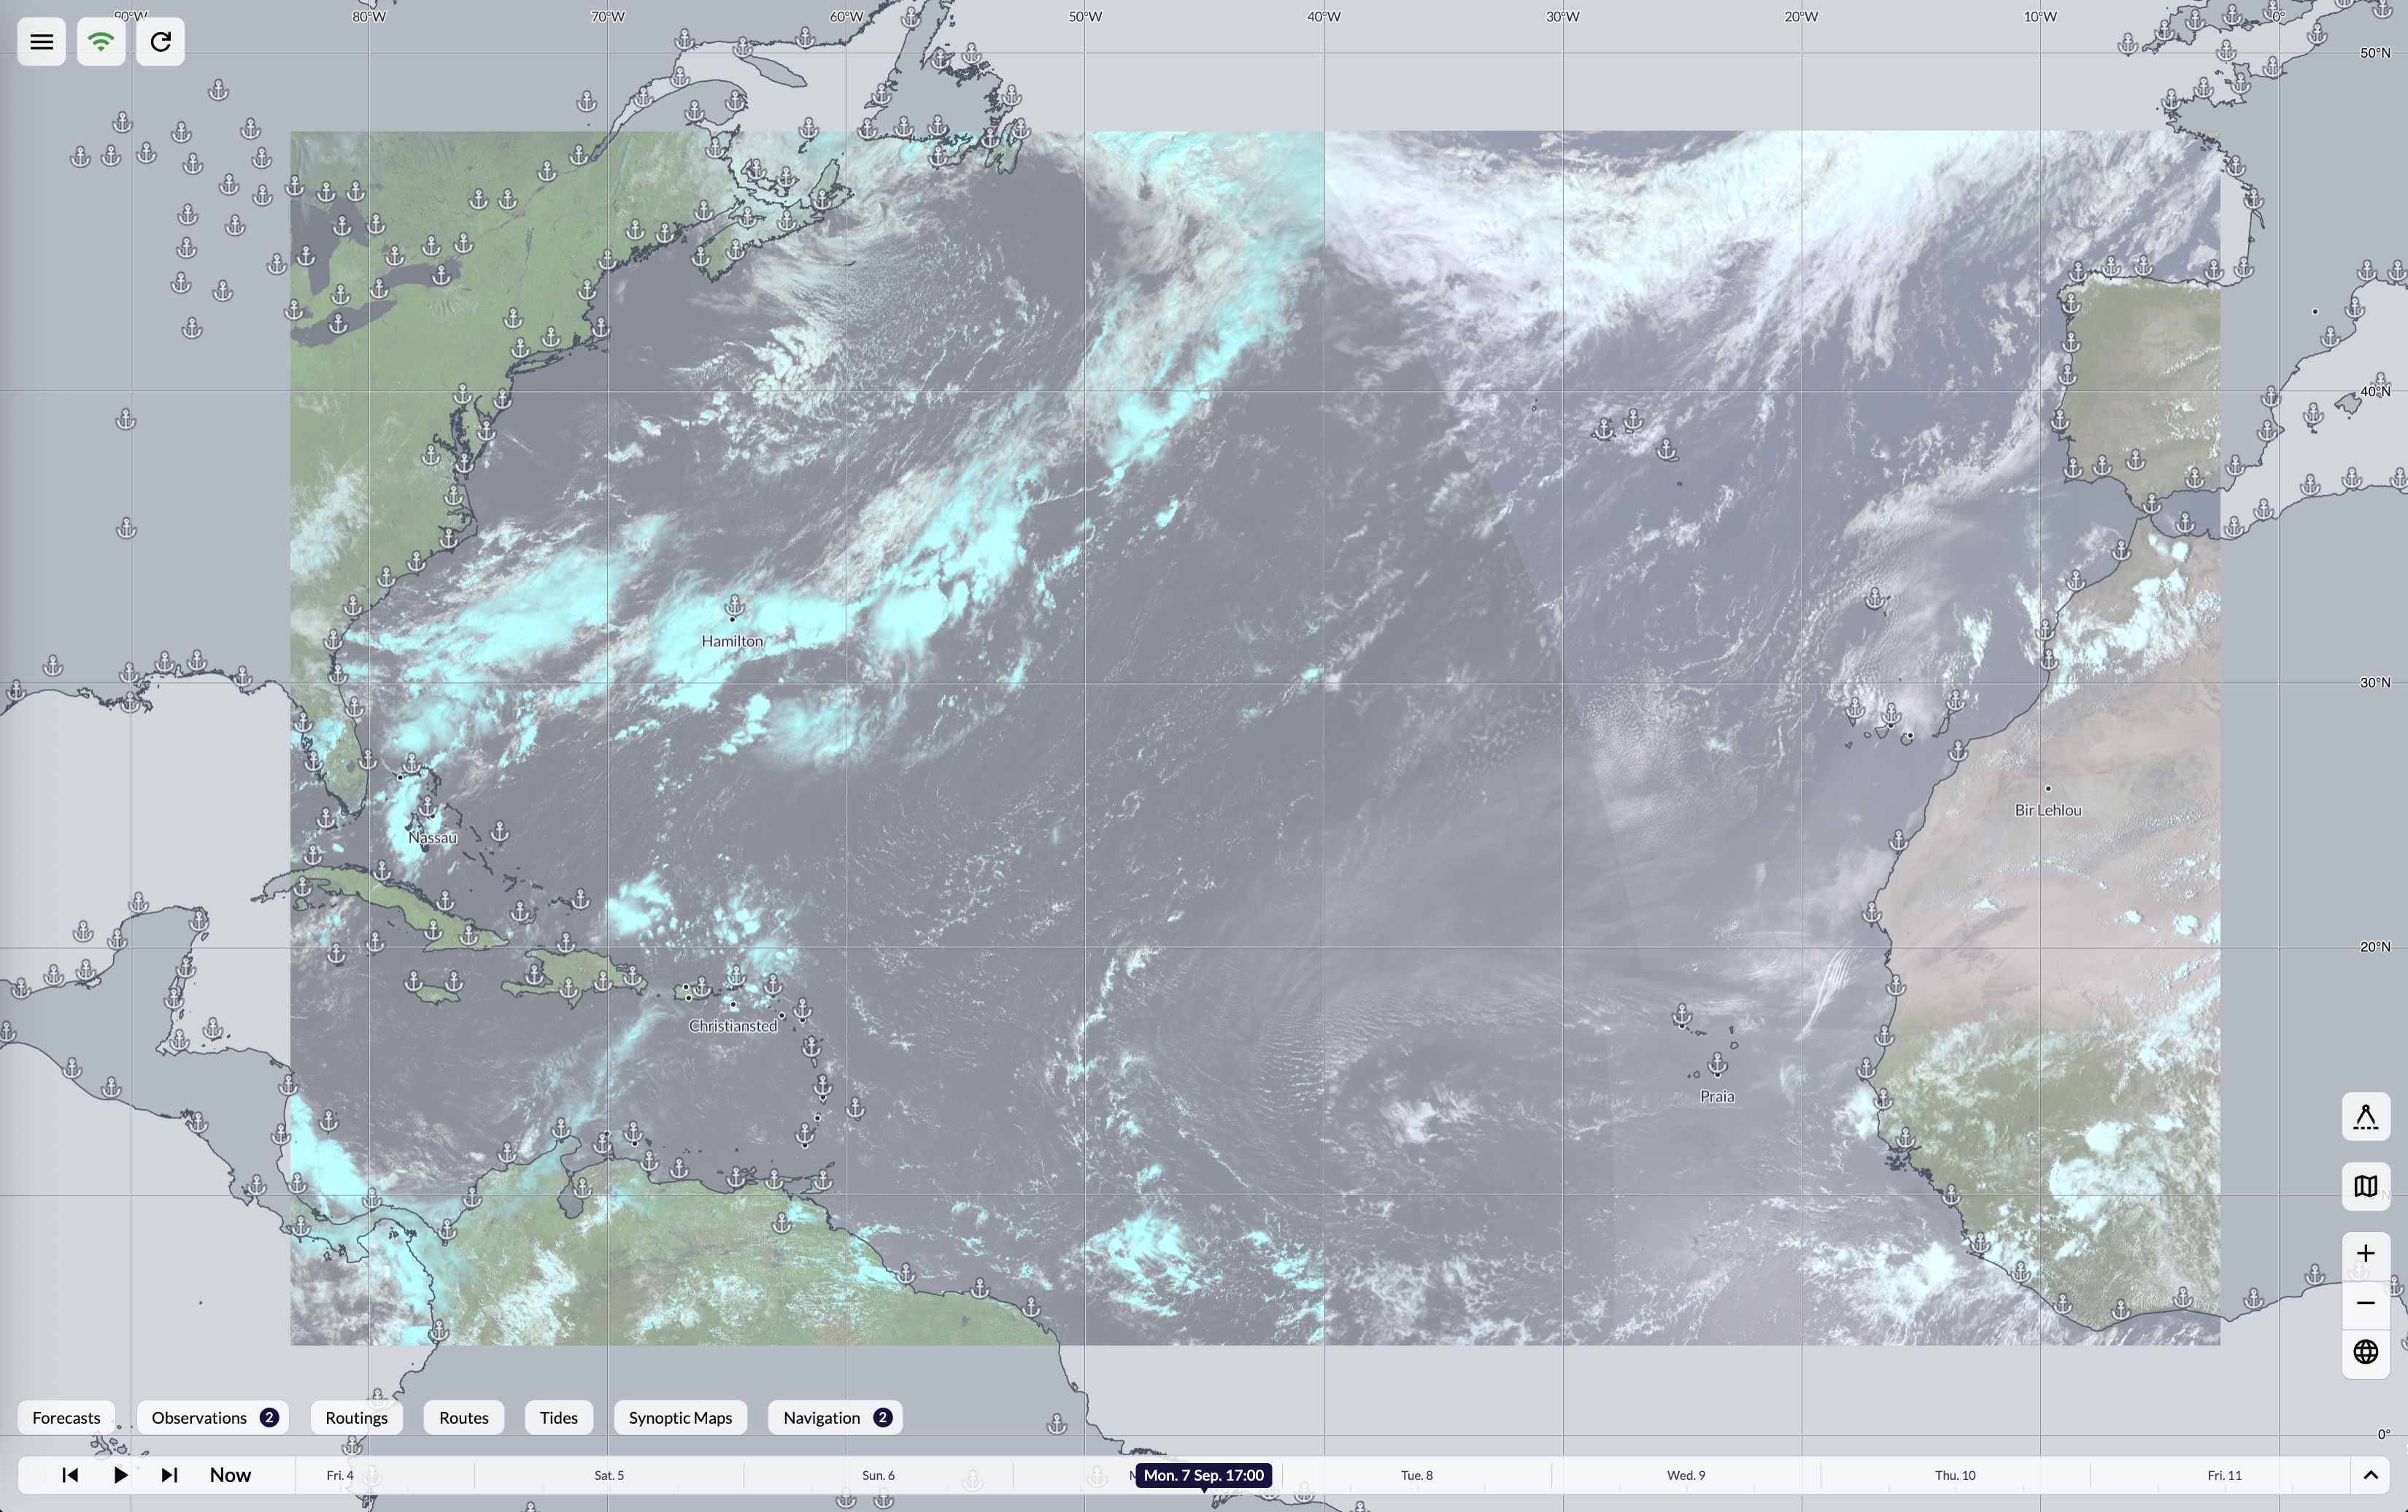
Meteosat imagery, including a high-definition European option, in infrared and visible-light channels.
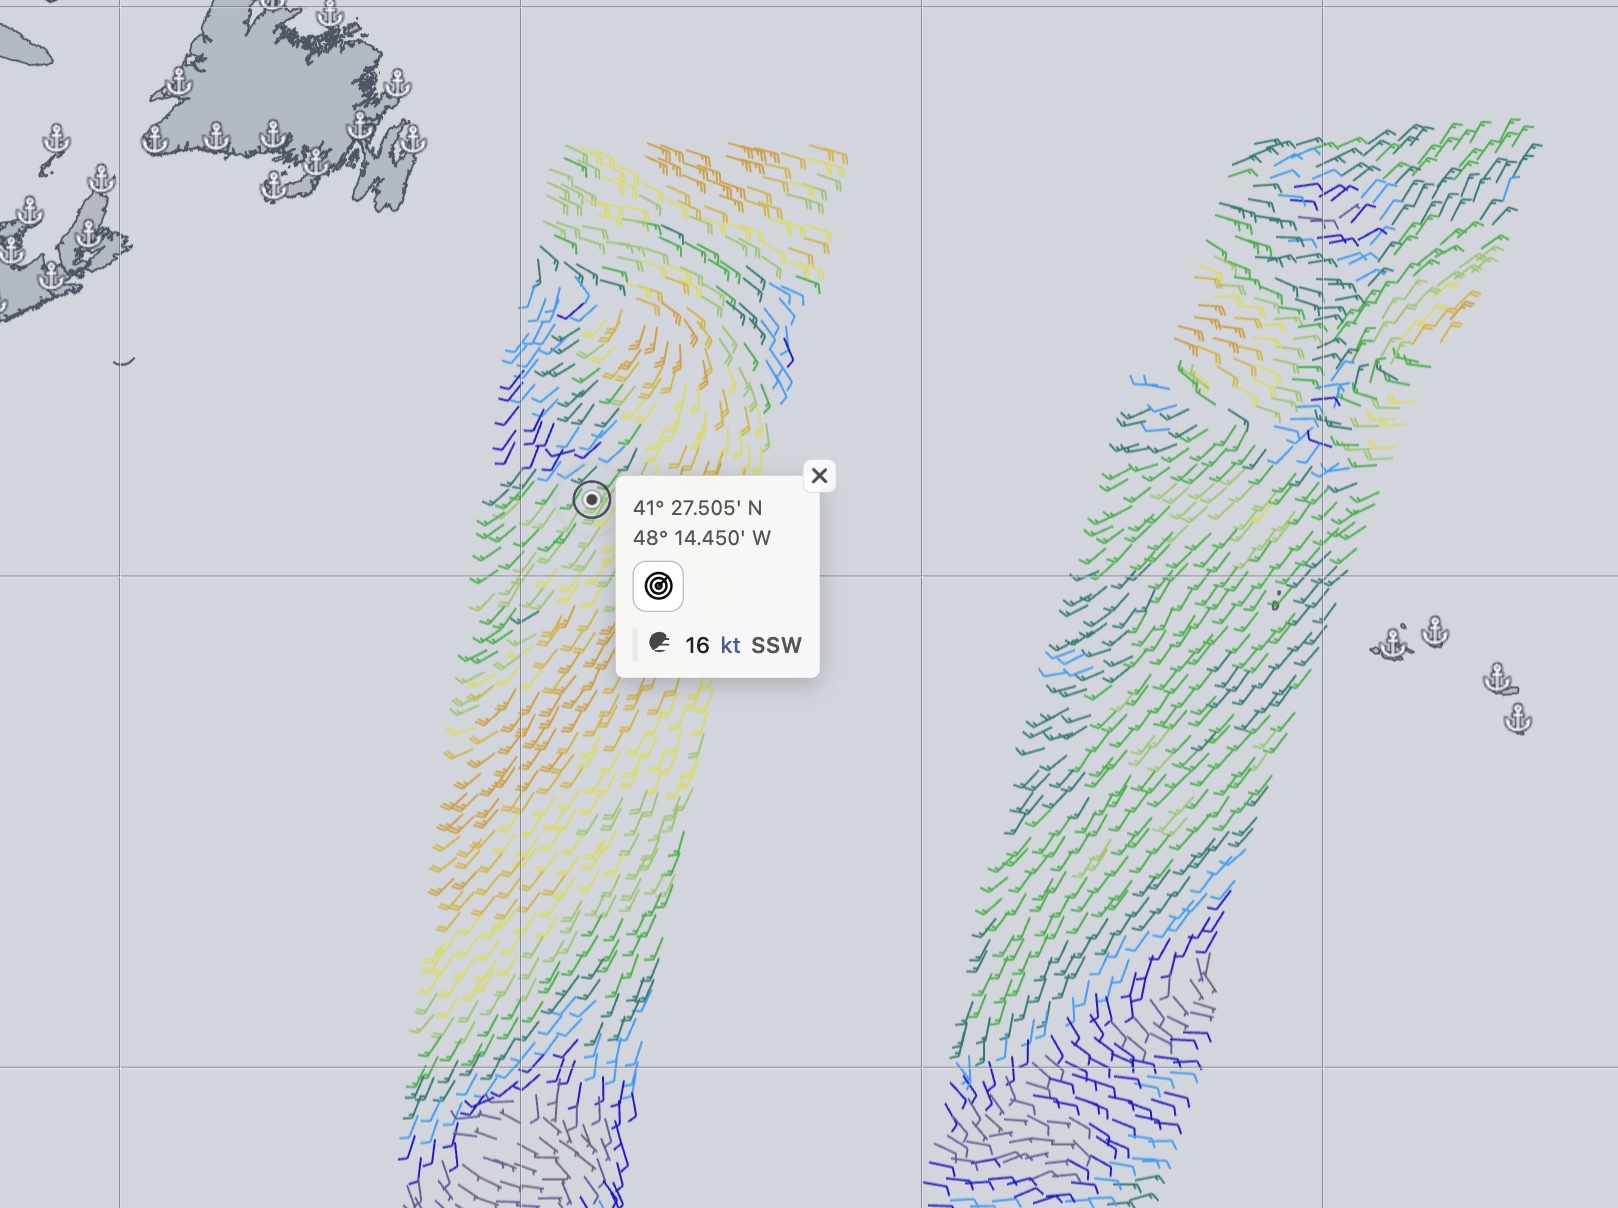
ASCAT
Scatterometer wind measurements collected along satellite passes — bands of data, not continuous coverage, so a given spot may only be observed once or twice a day. That's normal, not a failed download; the timeline uses a wider time tolerance for ASCAT so passes stay easy to select.
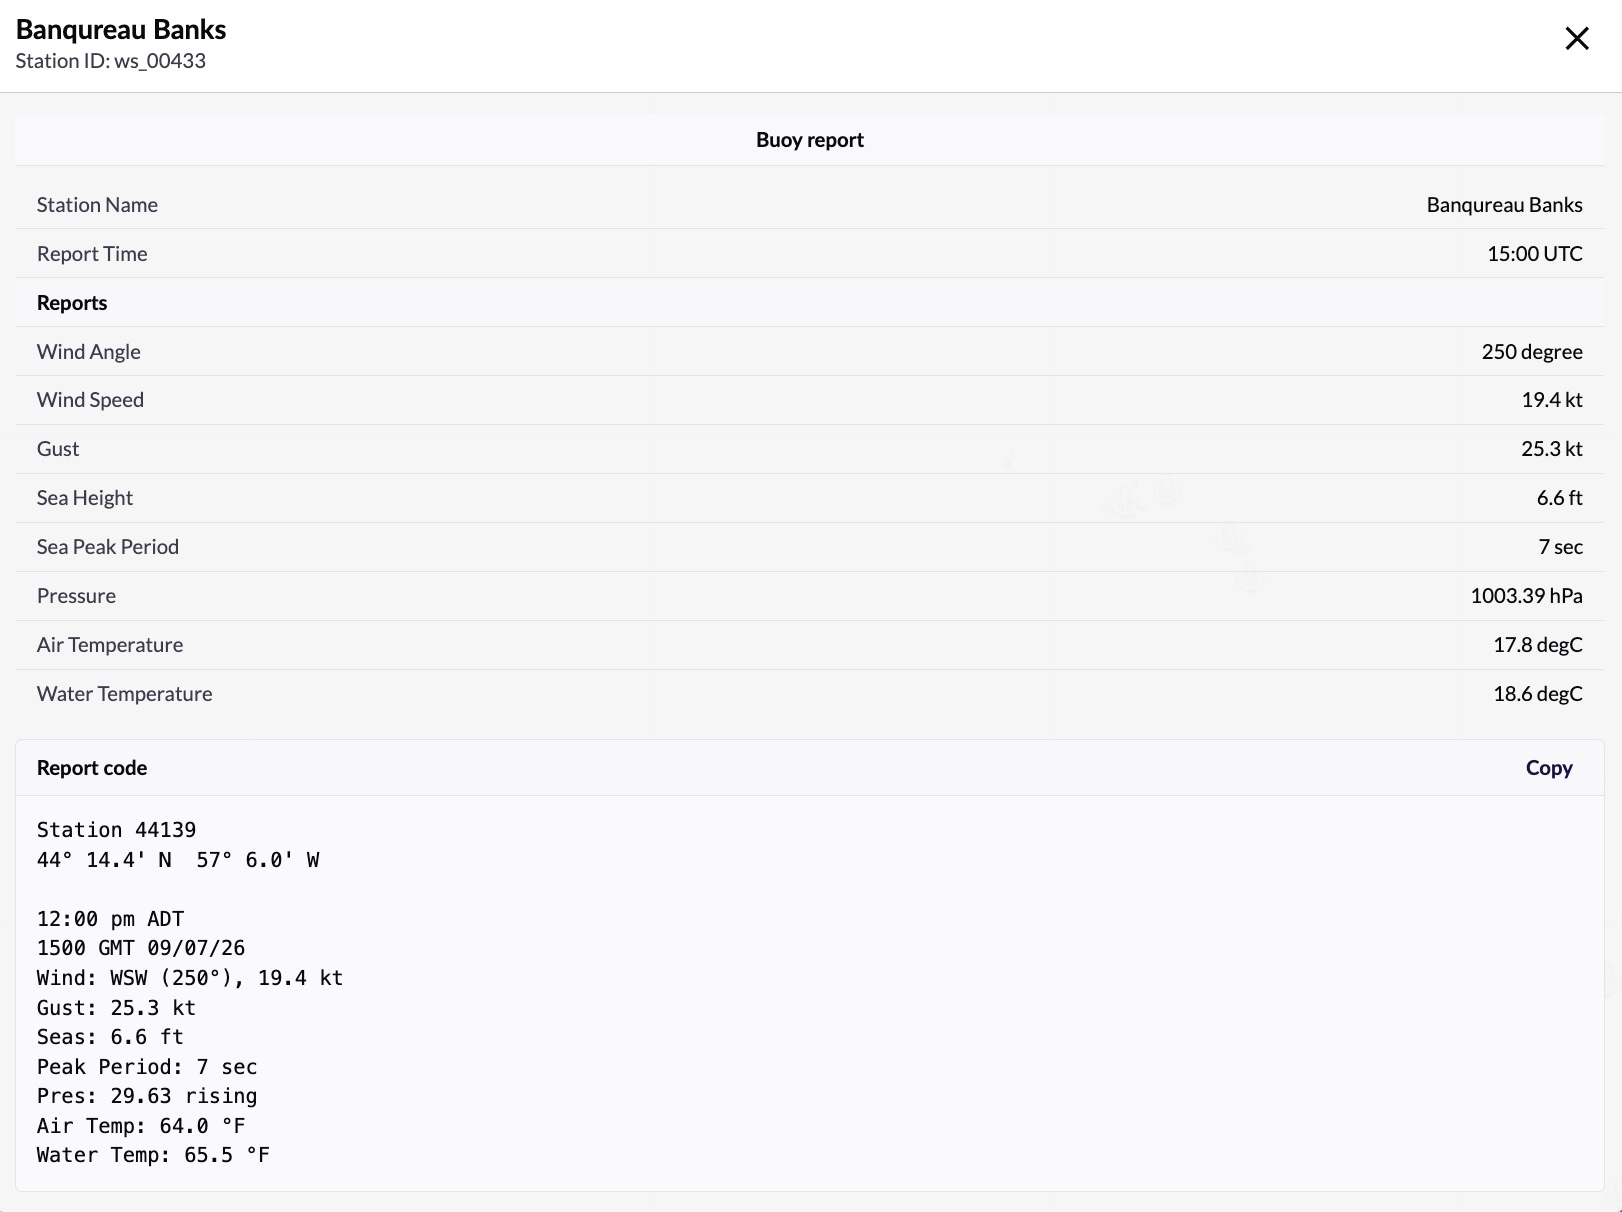
Synop/Metar
Ground station reports — wind, temperature, pressure, visibility and more depending on the station.
Adding an observation
From Observations → + Add observation, pick a type. Only Satellite Images has configuration: high-definition toggle, channels, a recency window (last 1/2/3/6 hours), and how many images to keep from it (all, every second, third, or sixth — useful for trimming download size). ASCAT and Synop/Metar need nothing further. Satellite imagery may be subscription-gated, shown as a lock icon if unavailable to you.
Area and download otherwise follow the shared Managing Data workflow.
Replacing or preserving satellite images
The first time you download while images already exist, you're asked to add to existing images or overwrite them — your choice is remembered for next time, and can be reset later.
Display, timeline, removal
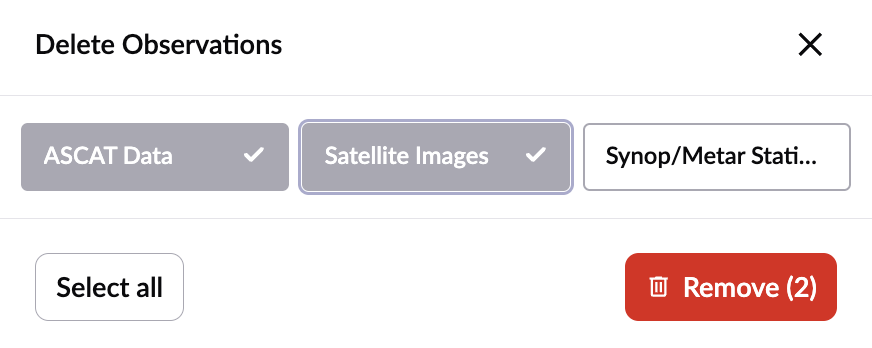
Toggle a downloaded product on/off from the carousel exactly like a forecast layer — hiding doesn't delete it. Observations share the Data Display timeline tab with forecasts, so you can park the cursor on a moment and compare a forecast field with, say, ASCAT's measured wind from roughly the same time. Remove a type entirely from Manage observations; this always clears the whole dataset for that type at once — to keep fewer satellite images, adjust the time range and frequency on your next request instead of deleting individual frames.
Synoptic Maps
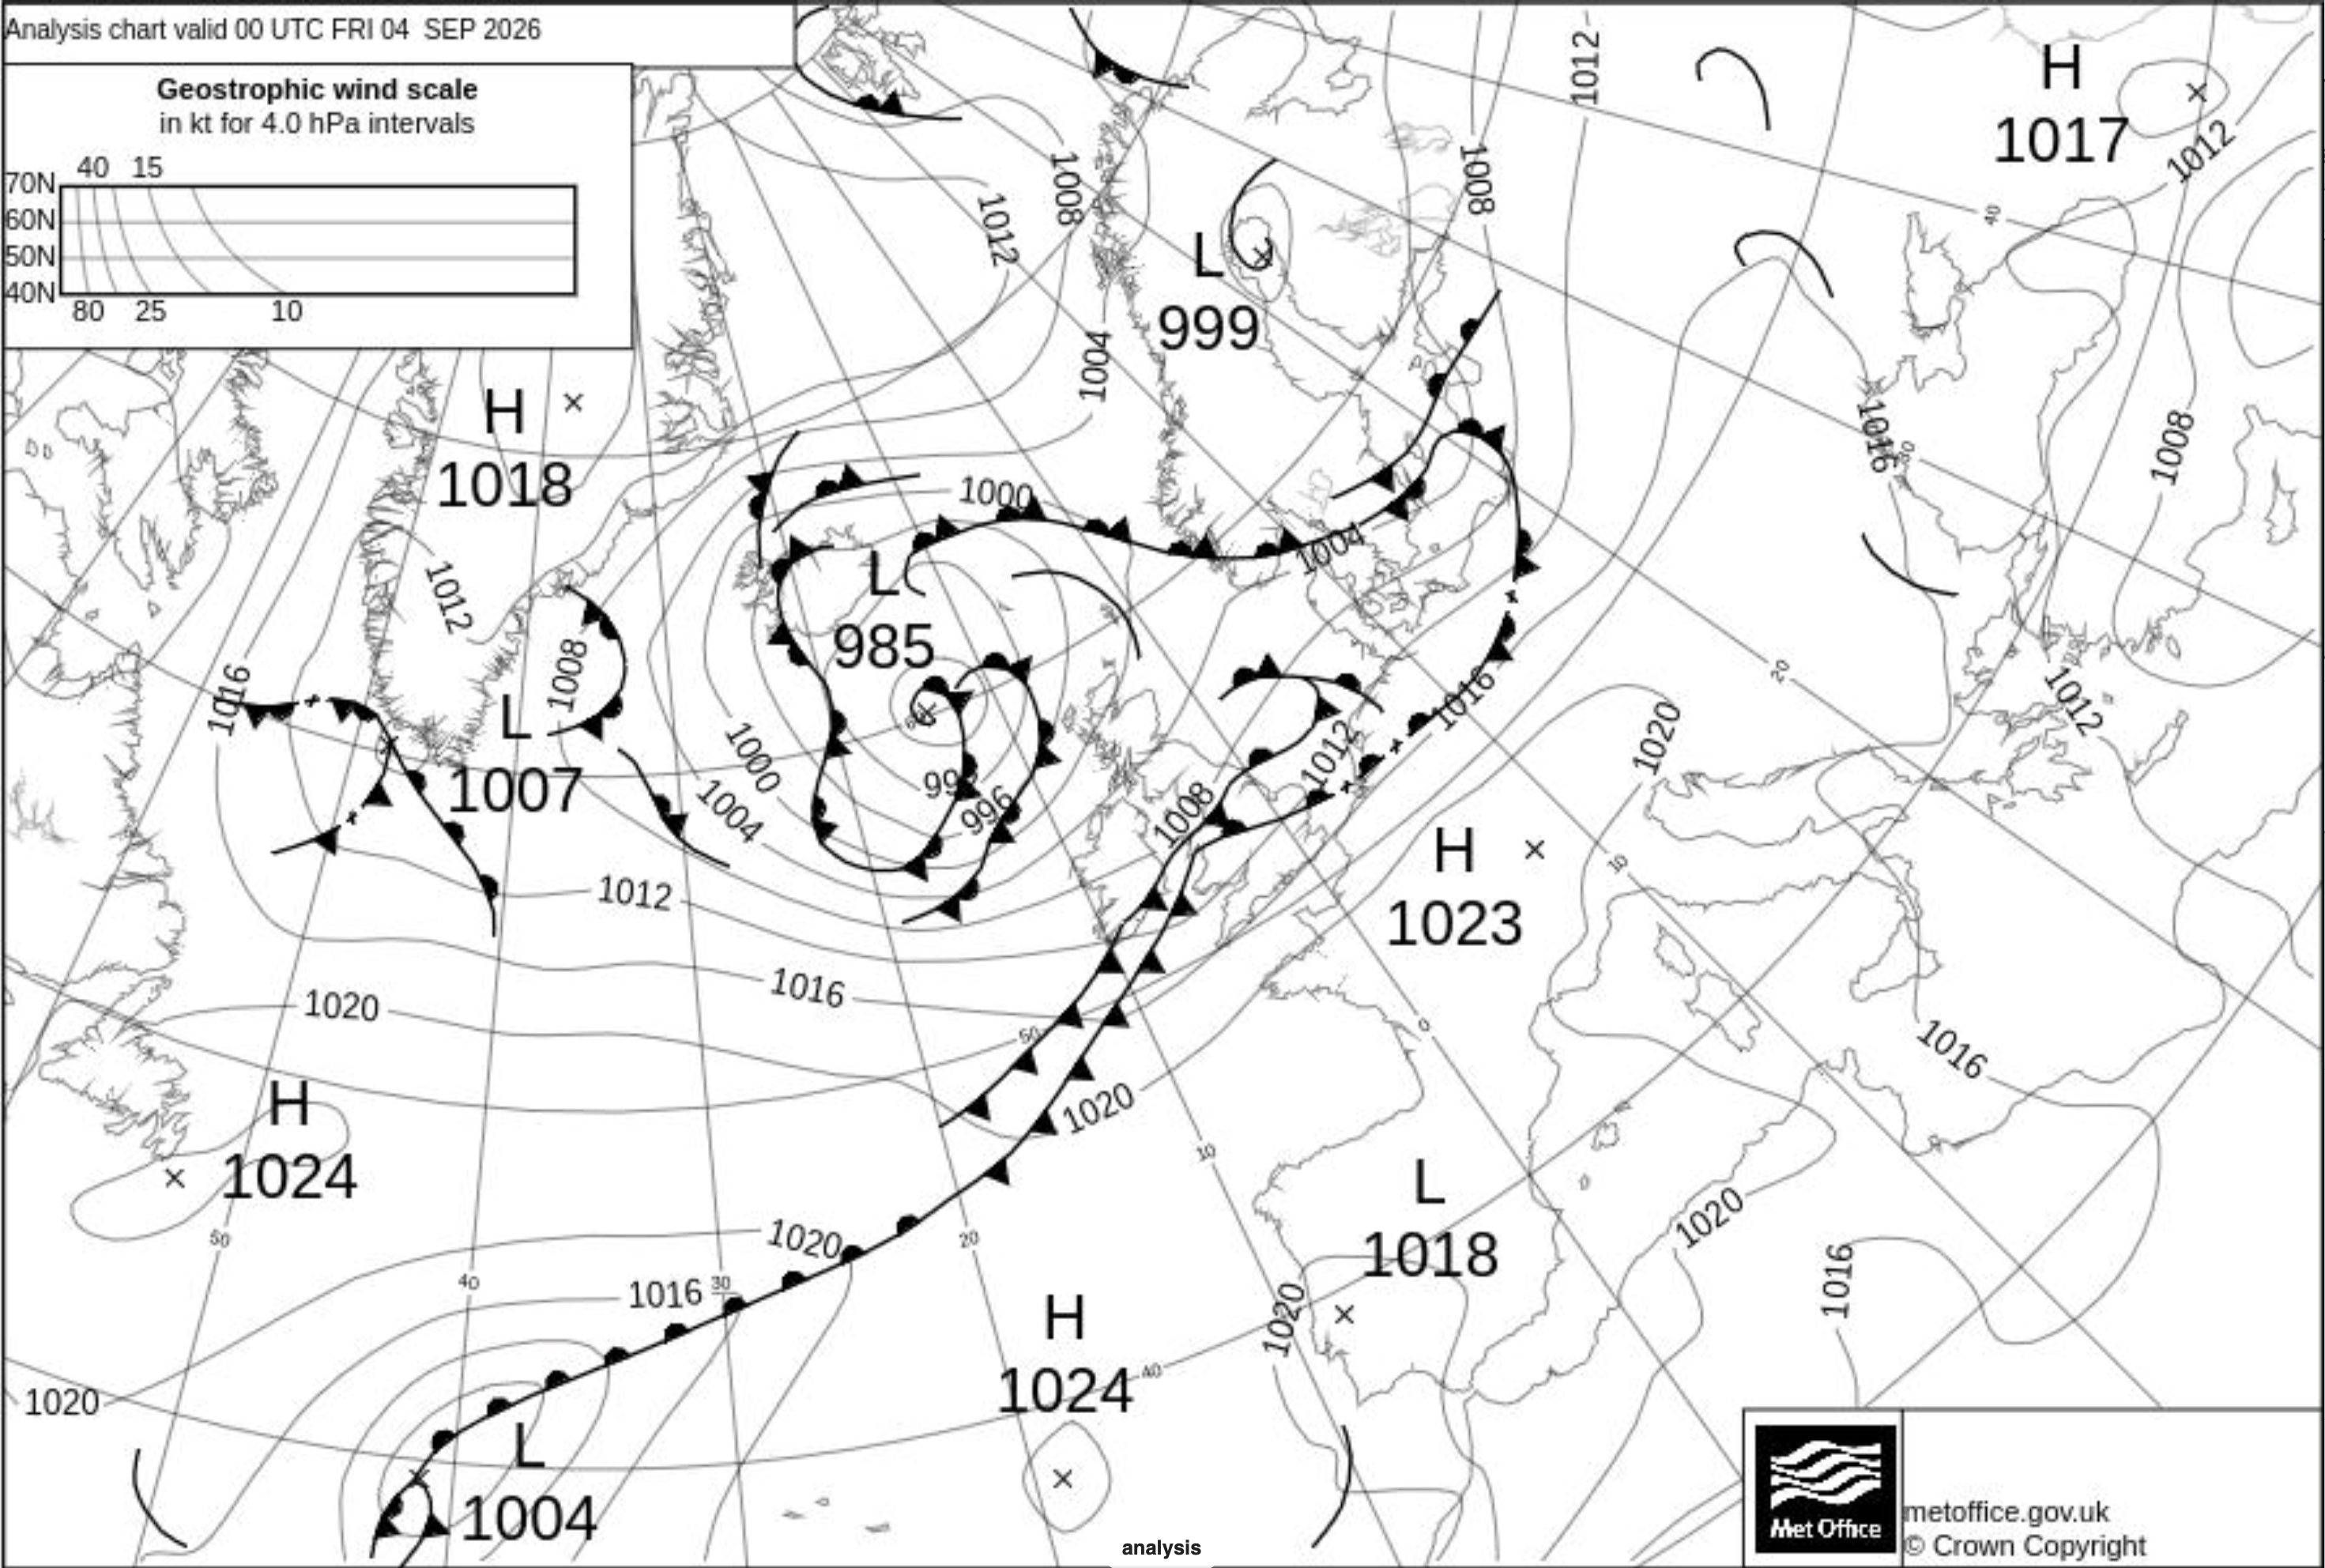
Published weather charts from meteorological services — analyses and forecast charts at specific lead times, each a separate dated document rather than a continuous feed.
Adding maps
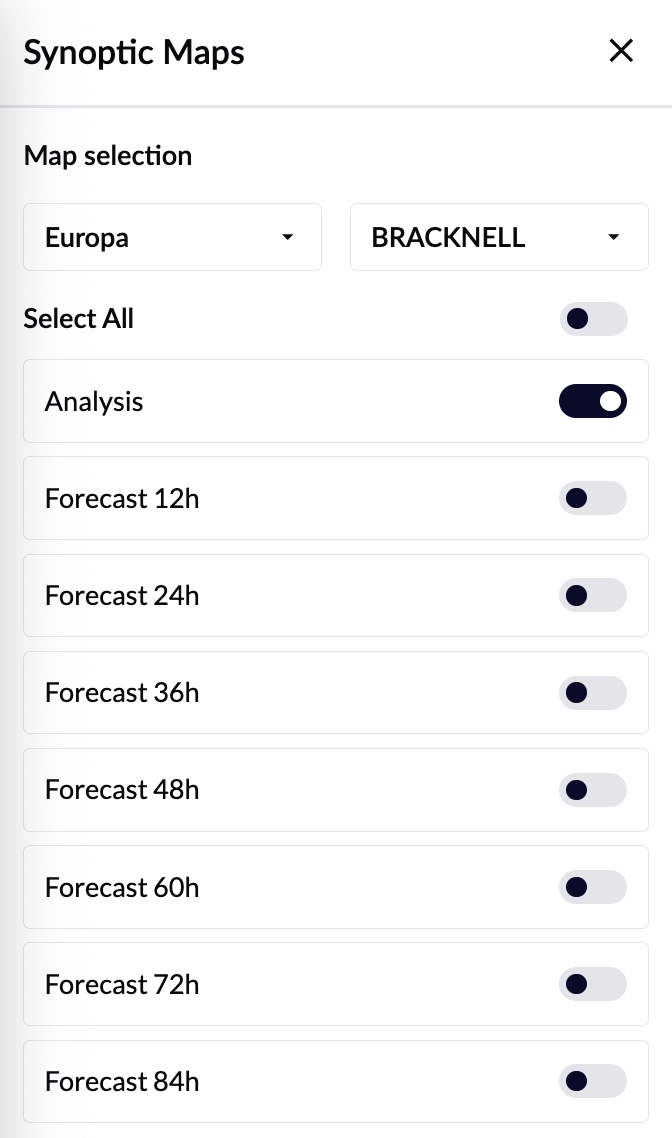
From Synoptic Maps → + Add map: pick an area (Europe by default), then a source — the list of sources updates to match what's actually published for that area. Each source offers its own chart types (analysis, various forecast ranges); enable the ones you want, or Select All, then Download Maps.
Displaying & navigating
Downloaded maps group by source; each chart is a small badge — filled means active, outlined means available. Select a badge to open that chart, select it again to close it, or select the source group itself to open its first chart. Because each chart is its own document rather than a timeline point, you move between them by picking a different badge, not by scrubbing — and the timeline's keyboard shortcuts are disabled while a map is open.
Opening a chart takes over the whole map area — the background dims and other interaction locks, giving maximum space for reading fronts, pressure systems and annotations. Close it via the badge again or its own close control to return to normal map interaction instantly.
Removing
Delete maps removes an entire source's charts in one action — individual charts can't be deleted alone. To keep only some, delete the source, re-add it, and download just the charts you want to keep.
Tides
Predictions for established stations, or for any point you choose yourself.
Stations
Search by name (3+ characters) — selecting a result zooms the map there — or click a station marker directly. Up to 10 stations at once, listed with name and coordinates.
Custom points
Long-click anywhere on the map to drop one. Rename or delete freely, before or after download — useful for an anchorage, harbour entrance, or any spot without a nearby station.
Stations and custom points combine in one request; select Download once you have what you need, and both types appear as individual cards in the Tides carousel.
Viewing tide data
Select a card to graph its curve in the timeline's Tides tab, with high and low tides marked directly on it (hovering near one snaps to its exact time and height). Only one location graphs at a time — selecting another swaps the curve and the highlighted map marker. When "now" falls within the data, a live indicator tracks the current predicted height as real time advances.

Refreshing & removing
Unlike most other data types, tide stations and points update and delete individually — refresh one location without touching the others, and remove exactly the ones you no longer need from the Tides management panel.
Routes and Waypoints
Route vs. routing. A route is the path you define — an ordered list of waypoints. A routing is a weather-optimized track calculated from a route. A routing always starts from an existing route; the two are stored and displayed independently, so you can show either, or both, at once. Full detail in Weather Routing.
Creating a route
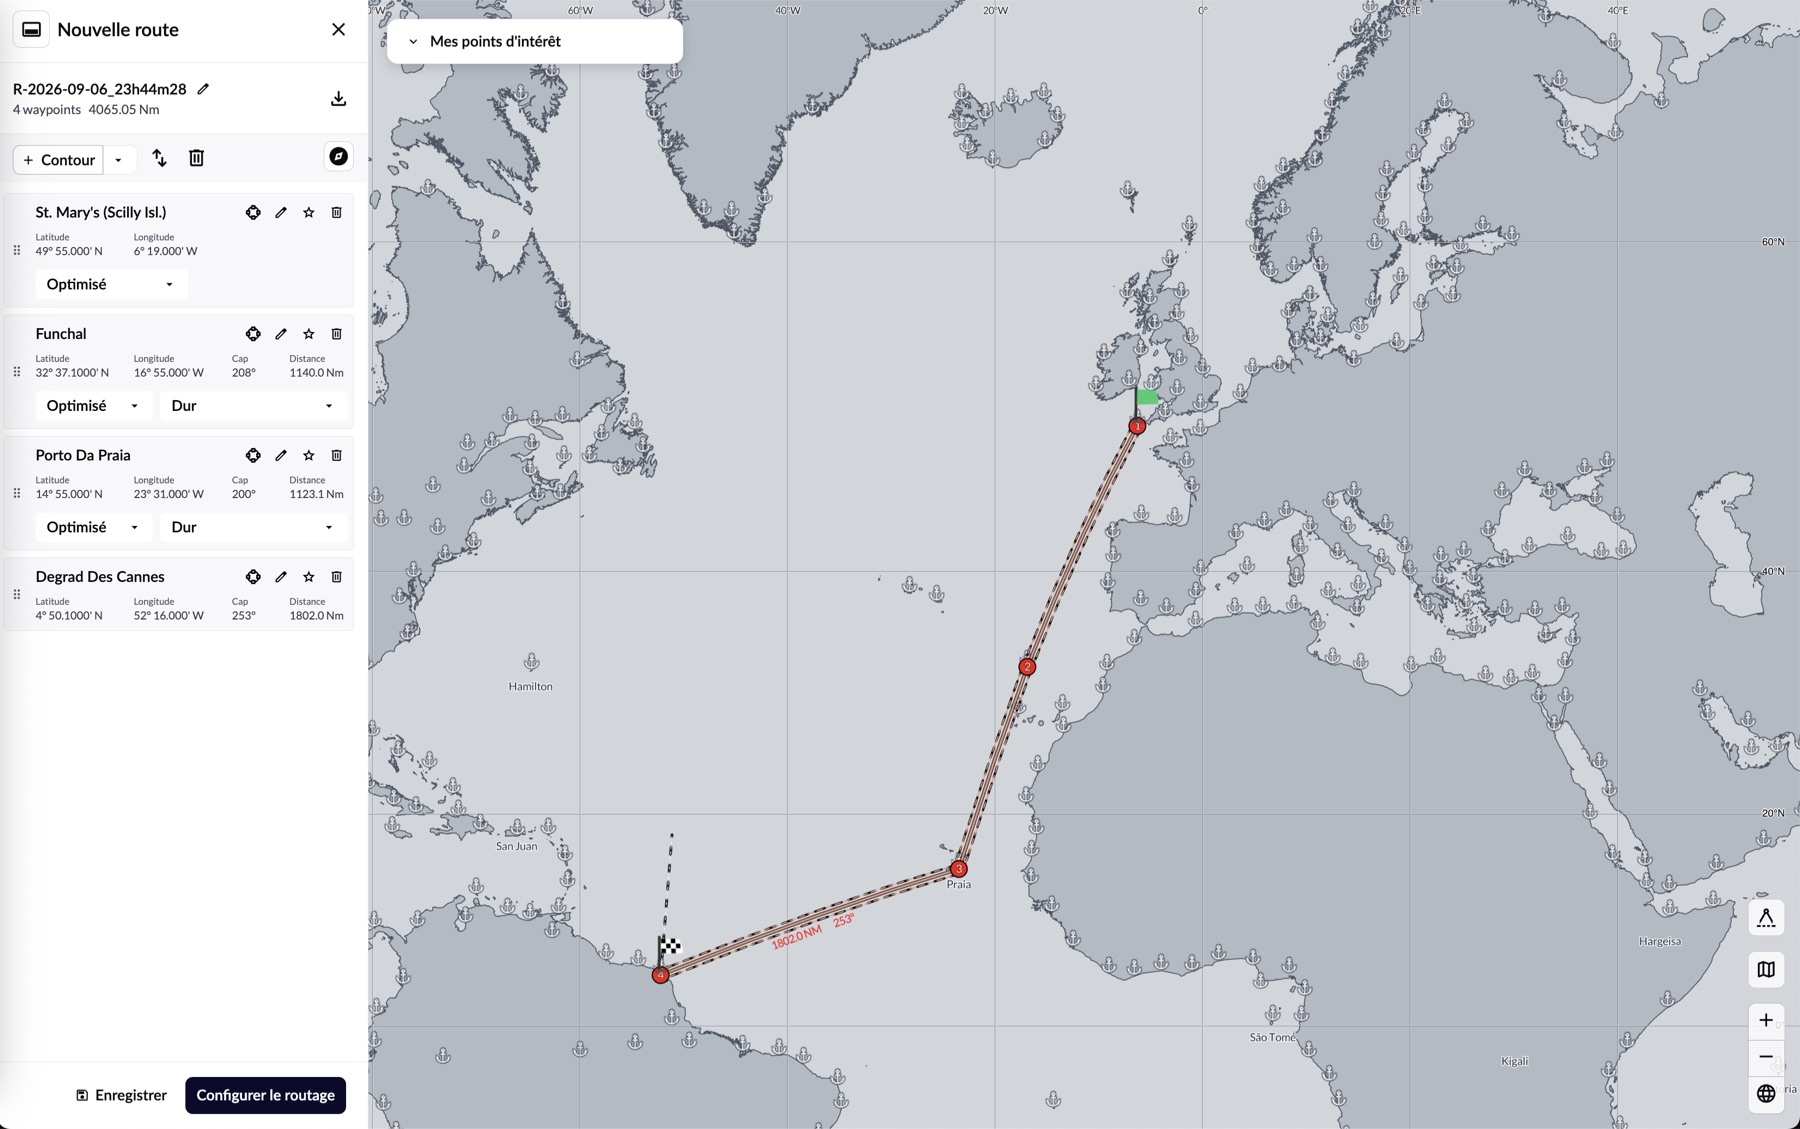
Routes → + New route opens the editor — add waypoints by clicking the map, or enter them manually. A route needs at least two. Route-wide tools: Reverse route (flips the order), Clear route, and Generate contour (a Standard or Large corridor around the route, handy for scoping a focused weather-download area instead of a big rectangle).
The editor docks as a sidebar or floats as a bottom sheet for more map space — switch anytime without affecting the route itself.
Editing waypoints
Drag in the waypoint list to reorder; each row has Focus (centre the map there), Edit (name/position), Favorite (save to the Waypoint Library for reuse across routes), and Delete. Tab / Shift+Tab moves between fields without the mouse. Coordinates support five formats — DD, DM.2, DM.3, DMS, DMS decimal — set from the editor's format control (also see Appendix B).
Saving, duplicating, showing
Save adds the route to the Routes carousel. Duplicate spins off an independent copy for comparing alternatives without touching the original. Only one route displays on the map at a time — selecting another swaps it, selecting the active one again hides it (display state never affects the saved route itself).
Each card's more options menu: Start routing, Edit, Duplicate, Export, Delete.
Import & export
Import: KML, XML, RTZ, GPX — imported routes behave exactly like ones built in Squid. Export: KML (Google Earth), GPX (general interchange), or RTZ in the variant your ECDIS/plotter expects — 1.0, 1.1, 1.2, or Sperry. Full format notes in Appendix C.
Hard and soft waypoints
Squid uses a simplified waypoint model built for sailing: each waypoint is Hard (must be passed exactly) or Soft (a radius, in nautical miles, the routing may deviate within) — the first and last waypoint of every route are always Hard. Legs are Optimized (the engine picks the best track) or Manual (a direct line).
Use Hard waypoints for straits, headlands, marks and mandatory passage points; use Soft — with a generous radius — where you want the engine free to find a faster path. As you build the route, each waypoint shows distance and bearing to the next, and soft waypoints show their radius, all editable inline.
Weather Routing
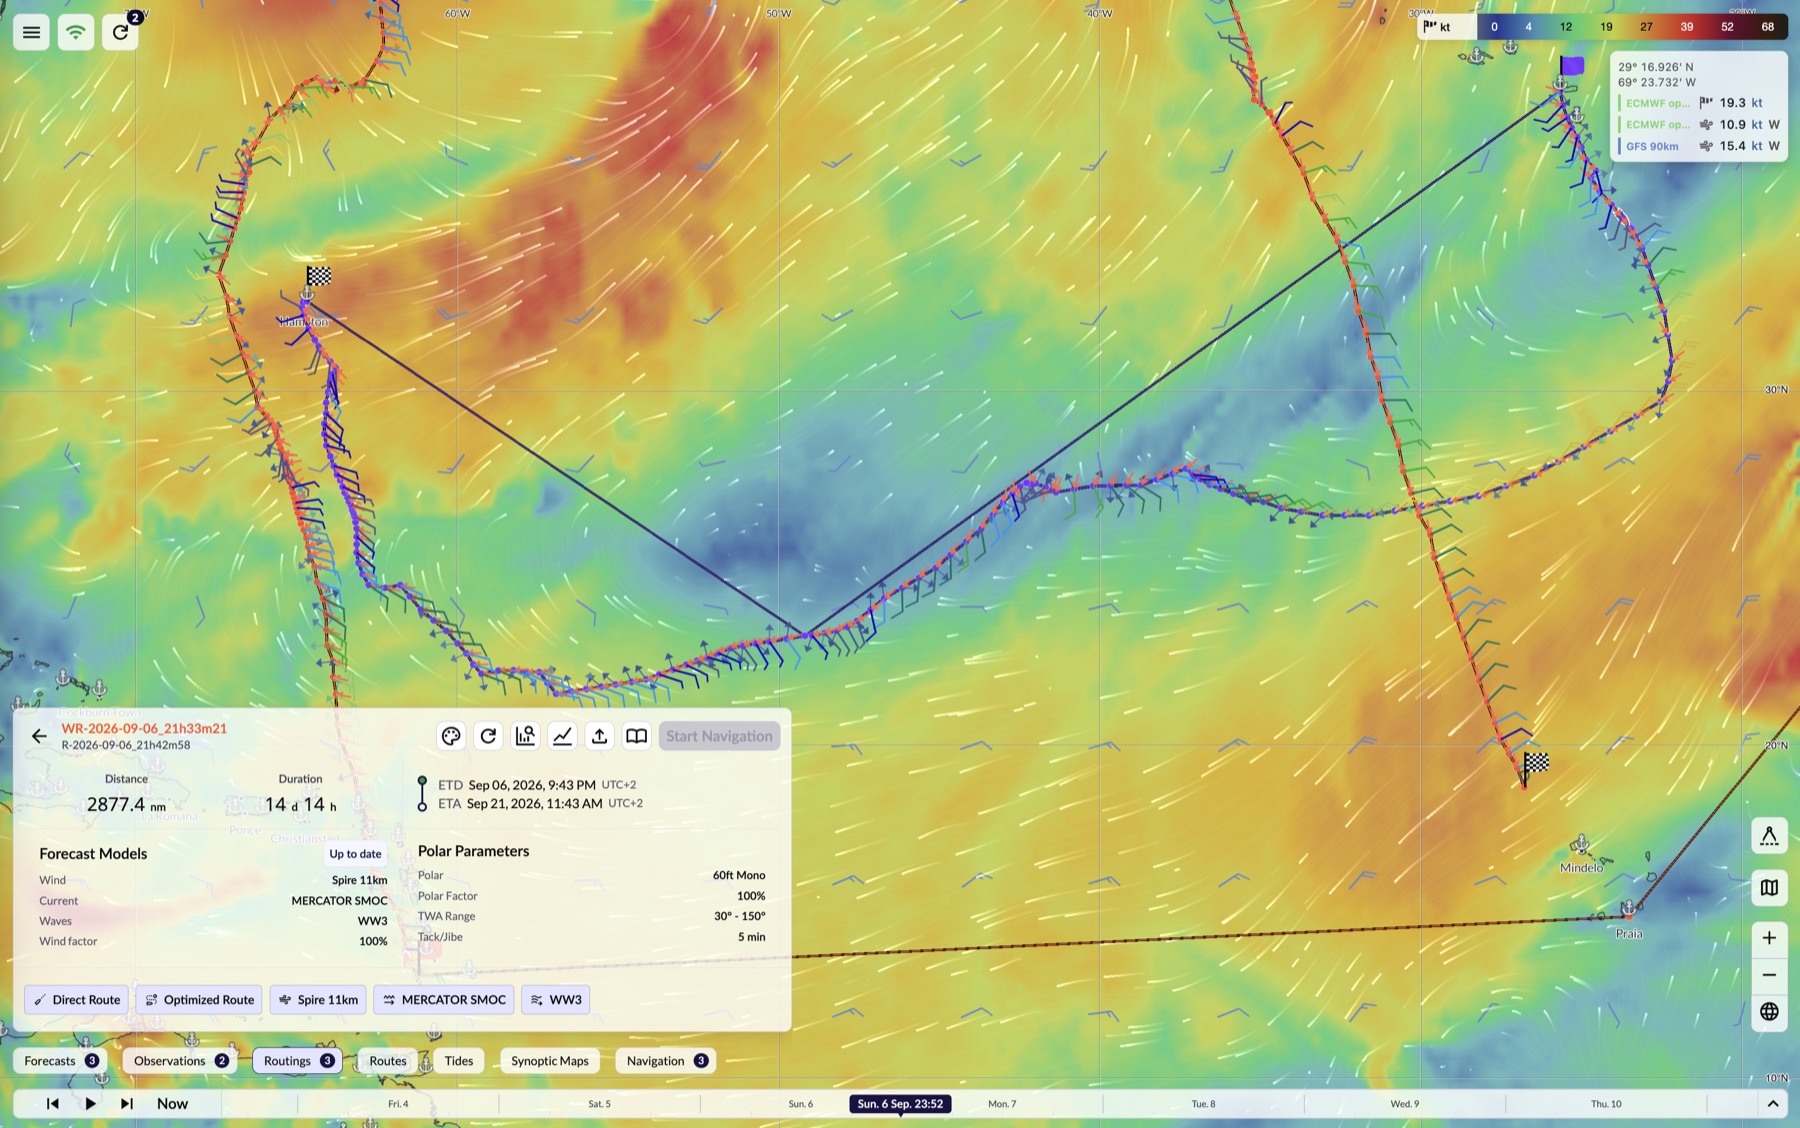
A routing calculates a passage from forecast conditions and vessel performance, rather than the shortest geometric line — accounting for wind, currents, waves, vessel performance, constraints, departure time and operating limits. On long passages the result can differ substantially from the direct route when favourable weather makes a longer path faster.
Route
The waypoints you defined — no weather solution of its own.
Routing
One calculation from a route. Create several from the same route with different models, times or settings — each stored independently.
Wind is the one required forecast input; add current and wave models when relevant. A routing's start and end are fixed by its route's first and last waypoints — change those in the route itself, not the routing config. Set a departure and target arrival time; Squid computes the average speed needed and flags a schedule outside your vessel's realistic range.
A calculated routing can be compared against its direct route — the unoptimized constant-course-and-speed baseline — to see exactly what weather optimization bought you in time, distance, course and exposure.
Basic and advanced configuration
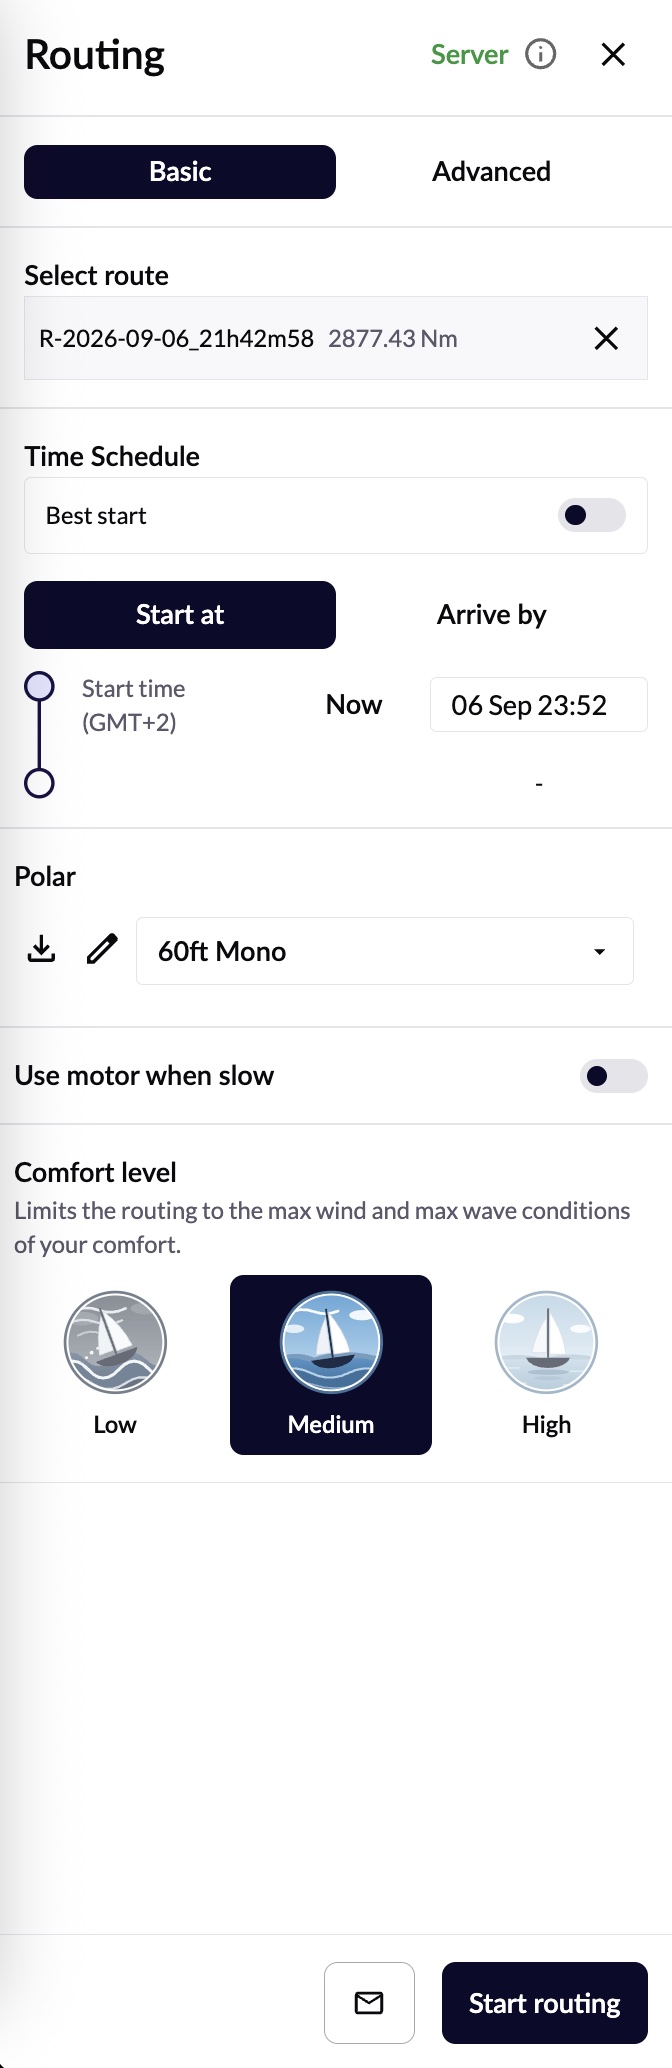
The routing configuration panel offers two modes, switched from tabs at the top of the panel.
Basic
Covers what most passages need: pick the route, set the schedule (Start At a fixed time, Arrive By a target, or toggle Best start to search a window automatically), choose a polar, and optionally enable motor assist — then cap the whole calculation with a single Comfort level (Low, Medium or High), which limits the routing to the maximum wind and wave conditions that level allows.
Advanced
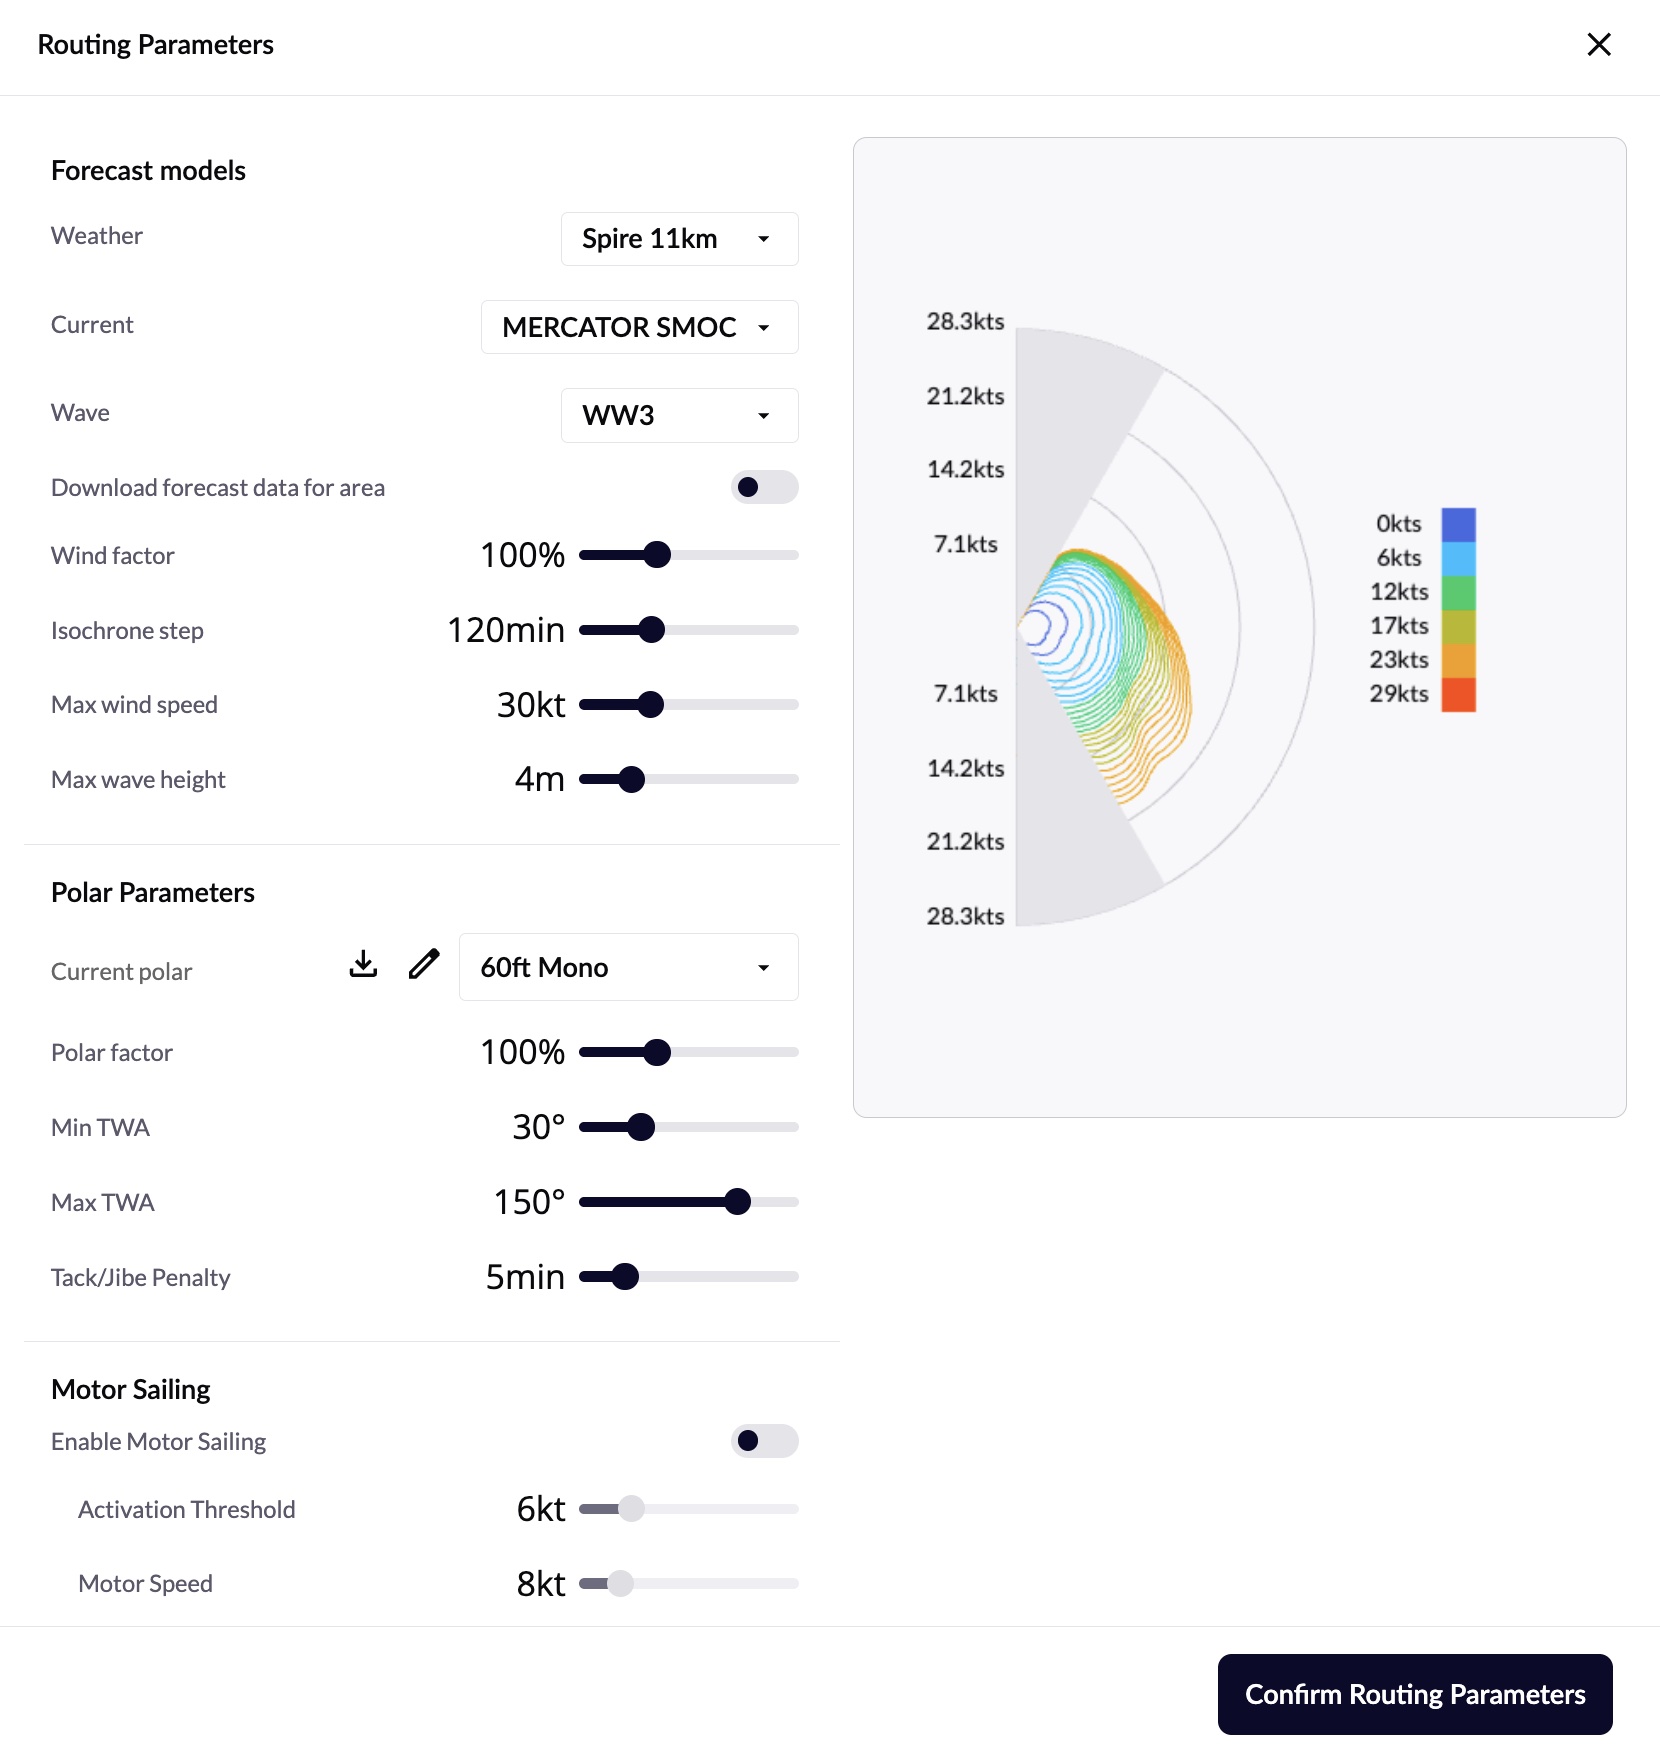
Exposes every one of those parameters individually instead of the single comfort slider: separate wind, current and wave models, a wind factor, isochrone step, explicit max wind speed and max wave height, full polar settings (polar factor, min/max TWA, tack/jibe penalty), and motor sailing's activation threshold and speed. Switch here whenever the default coupling behind a comfort level isn't the trade-off you want.
Running a calculation
Start routing begins the calculation, with progress on the card; Cancel stops an in-progress one without touching the underlying route. Keep several completed routings from the same route to compare models, departure times, or constraints side by side. Independent overlay toggles per routing: original route, calculated track, wind/current/waves along it, and exclusion zones — turn off what you don't need to keep a busy result readable.
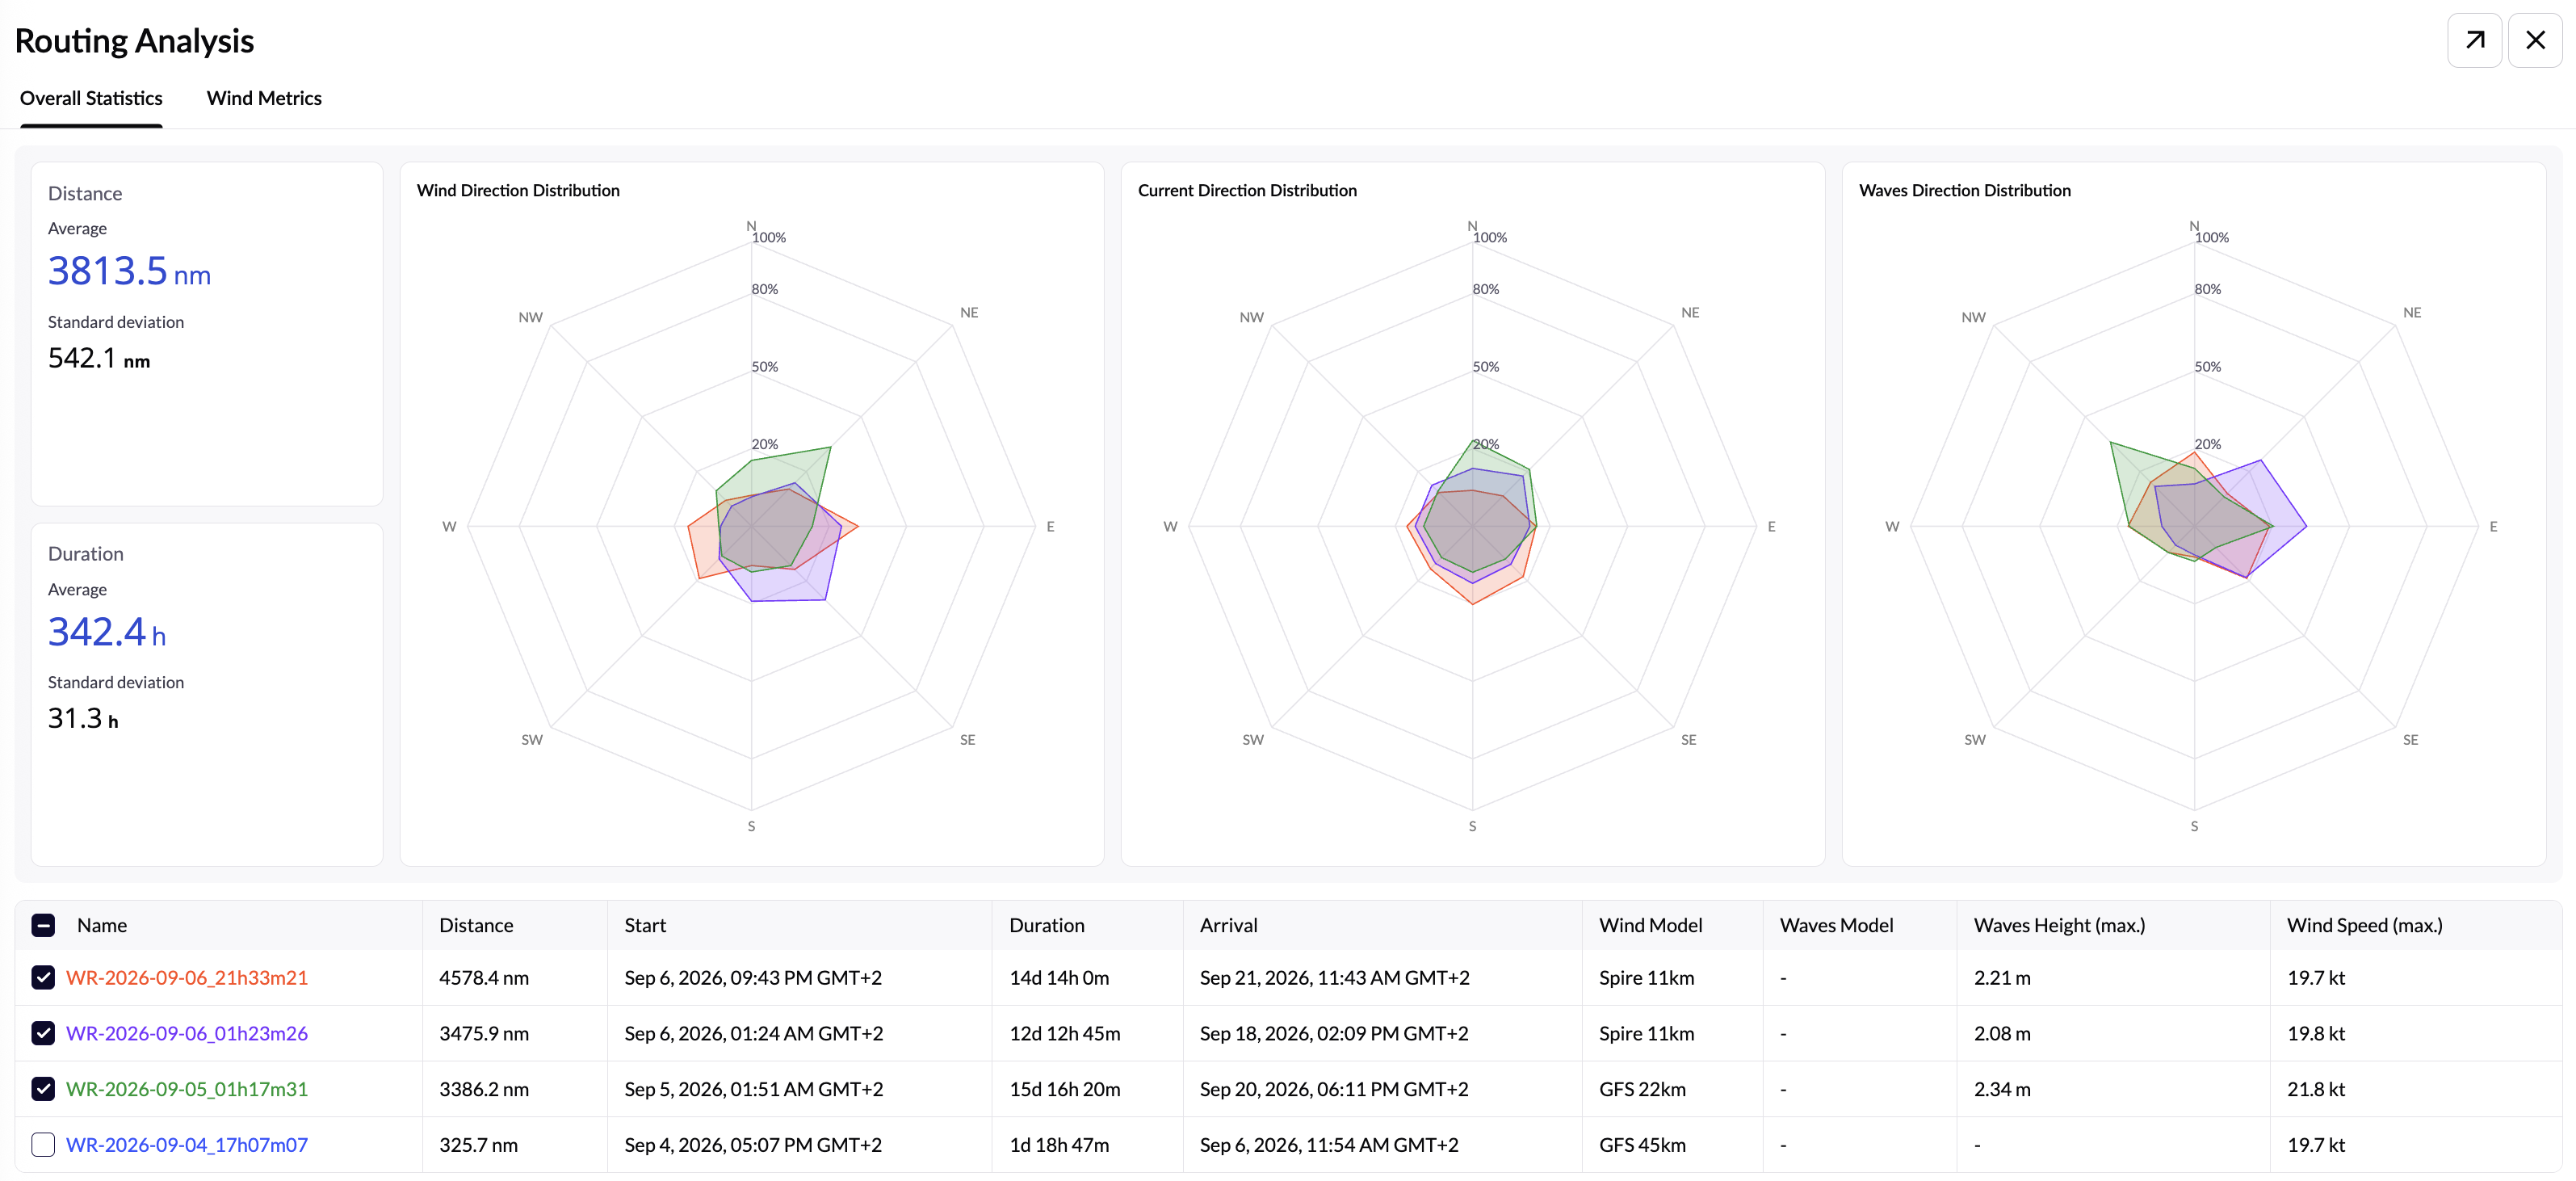
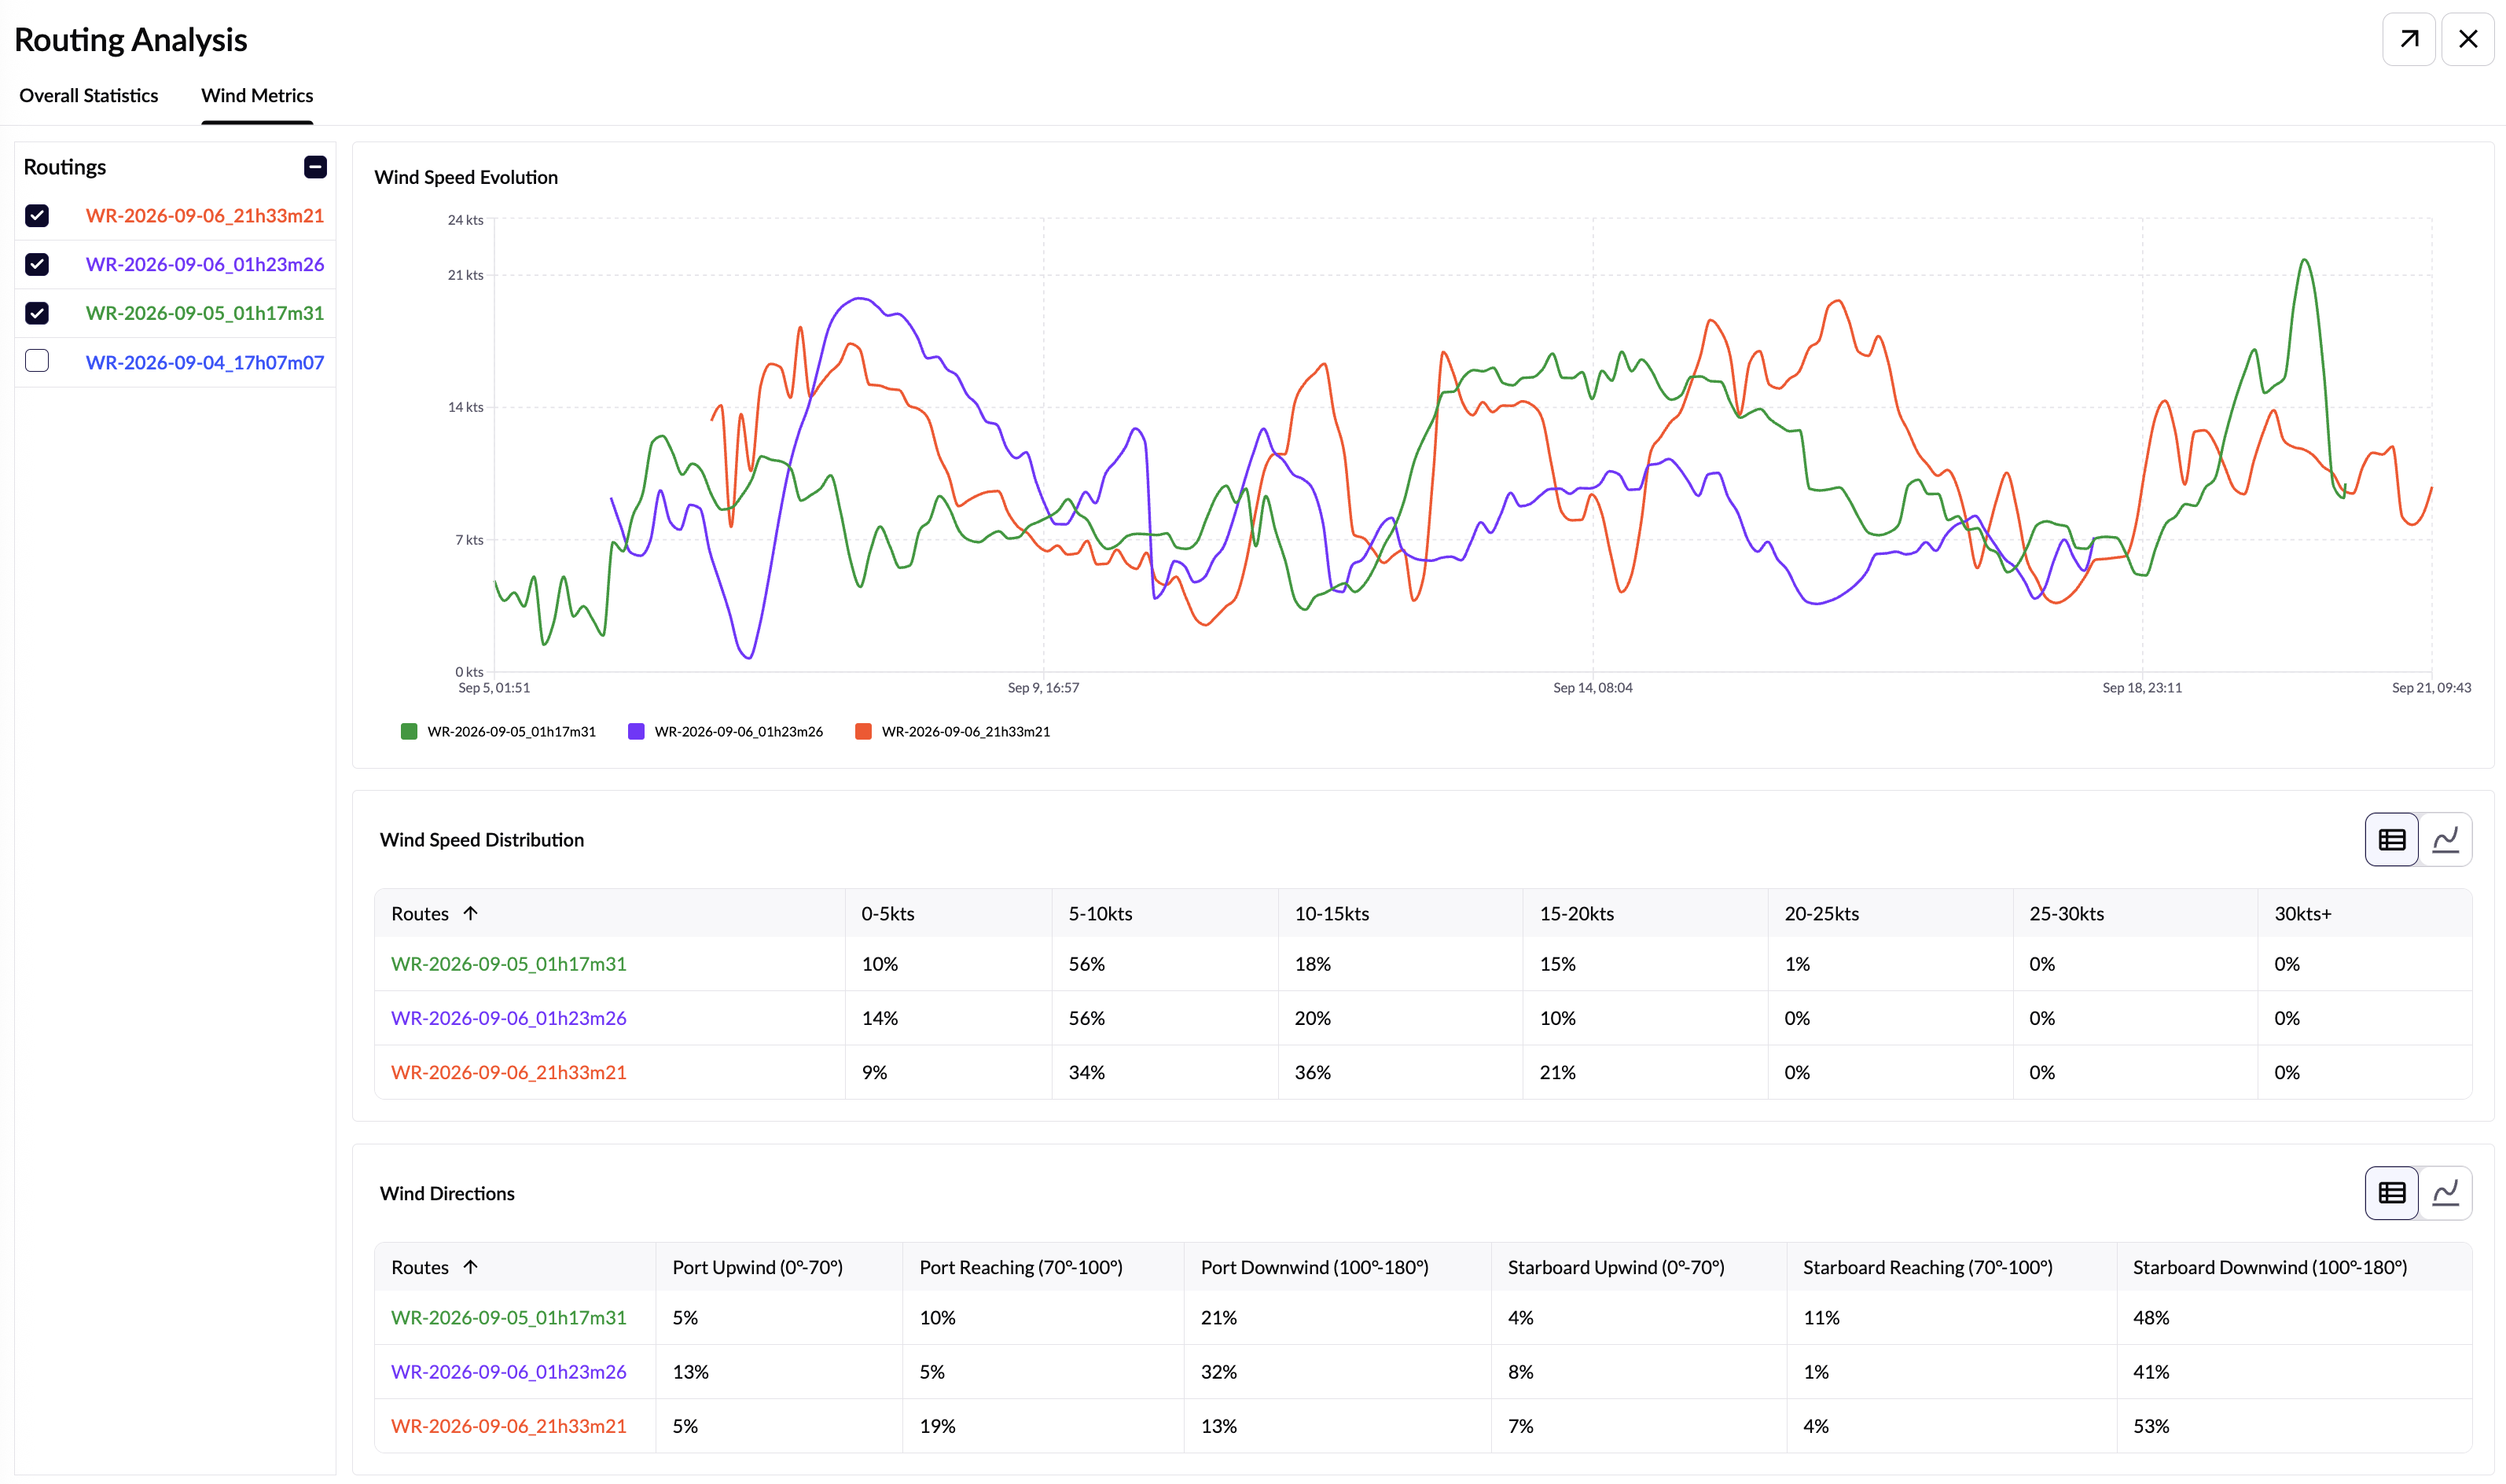
Select several routings and open Routing Analysis to compare them directly: an Overall Statistics tab lines up average distance and duration with direction-distribution radar charts for wind, current and waves, plus a per-routing summary table (start/arrival, models, max wave height and wind speed); a Wind Metrics tab overlays each routing's wind speed evolution on one chart, with wind speed distribution and point-of-sail (wind direction relative to the boat) tables underneath.
The graph plots wind speed, boat speed and current speed along the passage; the roadbook breaks the same result down point-by-point — position, time, course, speed, and conditions. Export a completed routing as KML, RTZ, or GPX for use in other navigation systems.
Sailing performance settings
Built around sailing performance: route, forecasts and your boat's polar diagram combine to find the best sailing track.
| Setting | What it does |
|---|---|
| Polar | The performance diagram matching your boat, shown graphically; the active TWA range is highlighted on it. |
| Polar factor | Scales that performance up or down — for a boat that under- or over-performs its reference polar (loading, sail condition, sea state, conservative sailing). |
| Min / Max TWA | Restricts which true wind angles the calculation may use. |
| Tack/Jibe penalty | A time cost per manoeuvre, so the calculation doesn't assume they're instant. |
| Motor Sailing | Engine assist below an Activation Threshold wind speed, at a set Motor Speed. |
| Advanced Settings | Unlocks the full set at once, plus isochrone step and max wind/wave limits, used as safety or operating constraints. |
Best-start & ensemble
Best-start searches a window of candidate times instead of one fixed departure — Start At tries a range of departure times and compares results; Arrive By works backward from a target arrival window. It's unavailable together with an ensemble weather model, since both already produce multiple results (one per candidate time, or one per ensemble member) and can't combine.
Both are shown as a grouped routing — a comparison view of the spread, rather than a pile of separate cards. To compare genuinely different setups (models, polar factors, wind/wave limits, motor sailing on or off), create separate routing cards instead.
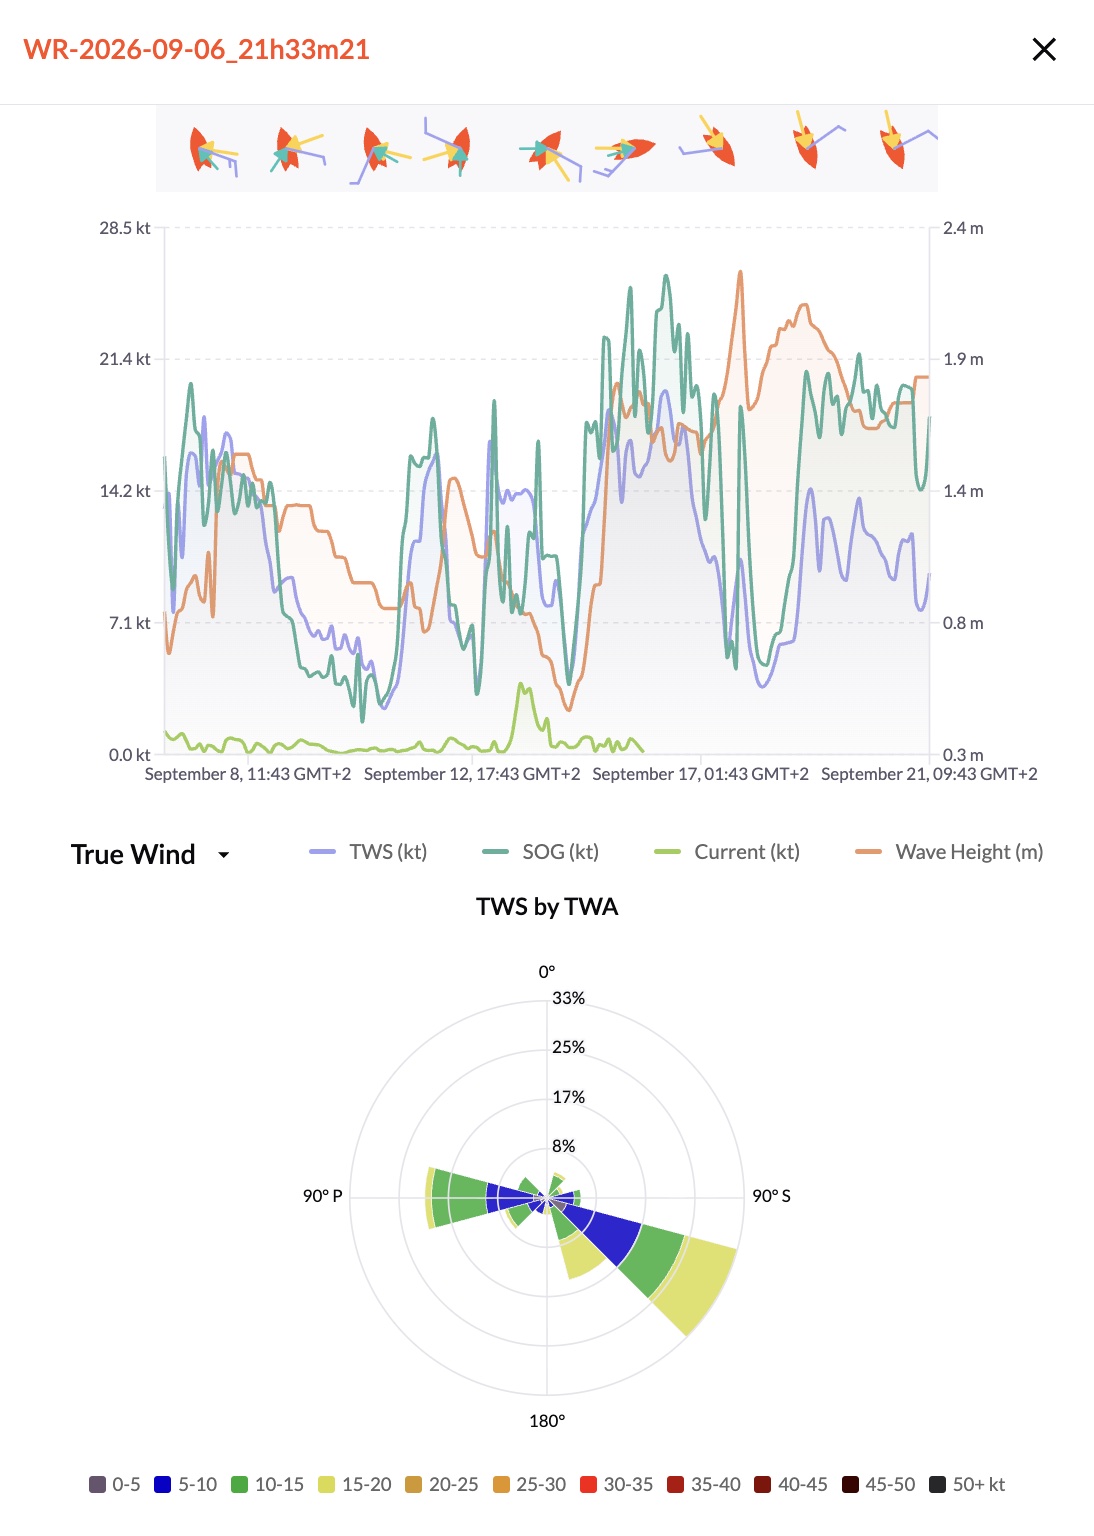
The routing graph adds true/apparent wind roses alongside speed traces; the roadbook lists every step with SOG/COG, TWS/TWA/TWD, AWS/AWA, current speed and direction, wave height and peak direction, and distance to the next point — wind and current angles shown as Port/Starboard relative to the boat, and current direction as where it's flowing to (opposite convention from wind — see Appendix B).
Boat Position and Navigation Data
Live position, course, speed and heading from onboard GPS/NMEA equipment, displayed on the map once connected.
Connecting Squid GPS
Two connection types: Serial/USB for a directly-connected receiver, or UDP for data already on the vessel's onboard network via a multiplexer or gateway. Configure manually, or use Auto-configure to probe for a working source automatically — if a connection was already active, it may drop briefly during detection and is restored if the new attempt fails.
Status shows as Disconnected, Connecting, Error (with a specific message, not just "failed"), or live once data flows. The vessel only appears on the map once the connection is genuinely active and a valid position has arrived — it's removed immediately if either stops, rather than showing stale data. The icon rotates with course over ground, and a projected course line appears when speed and course are reliable enough to be meaningful.
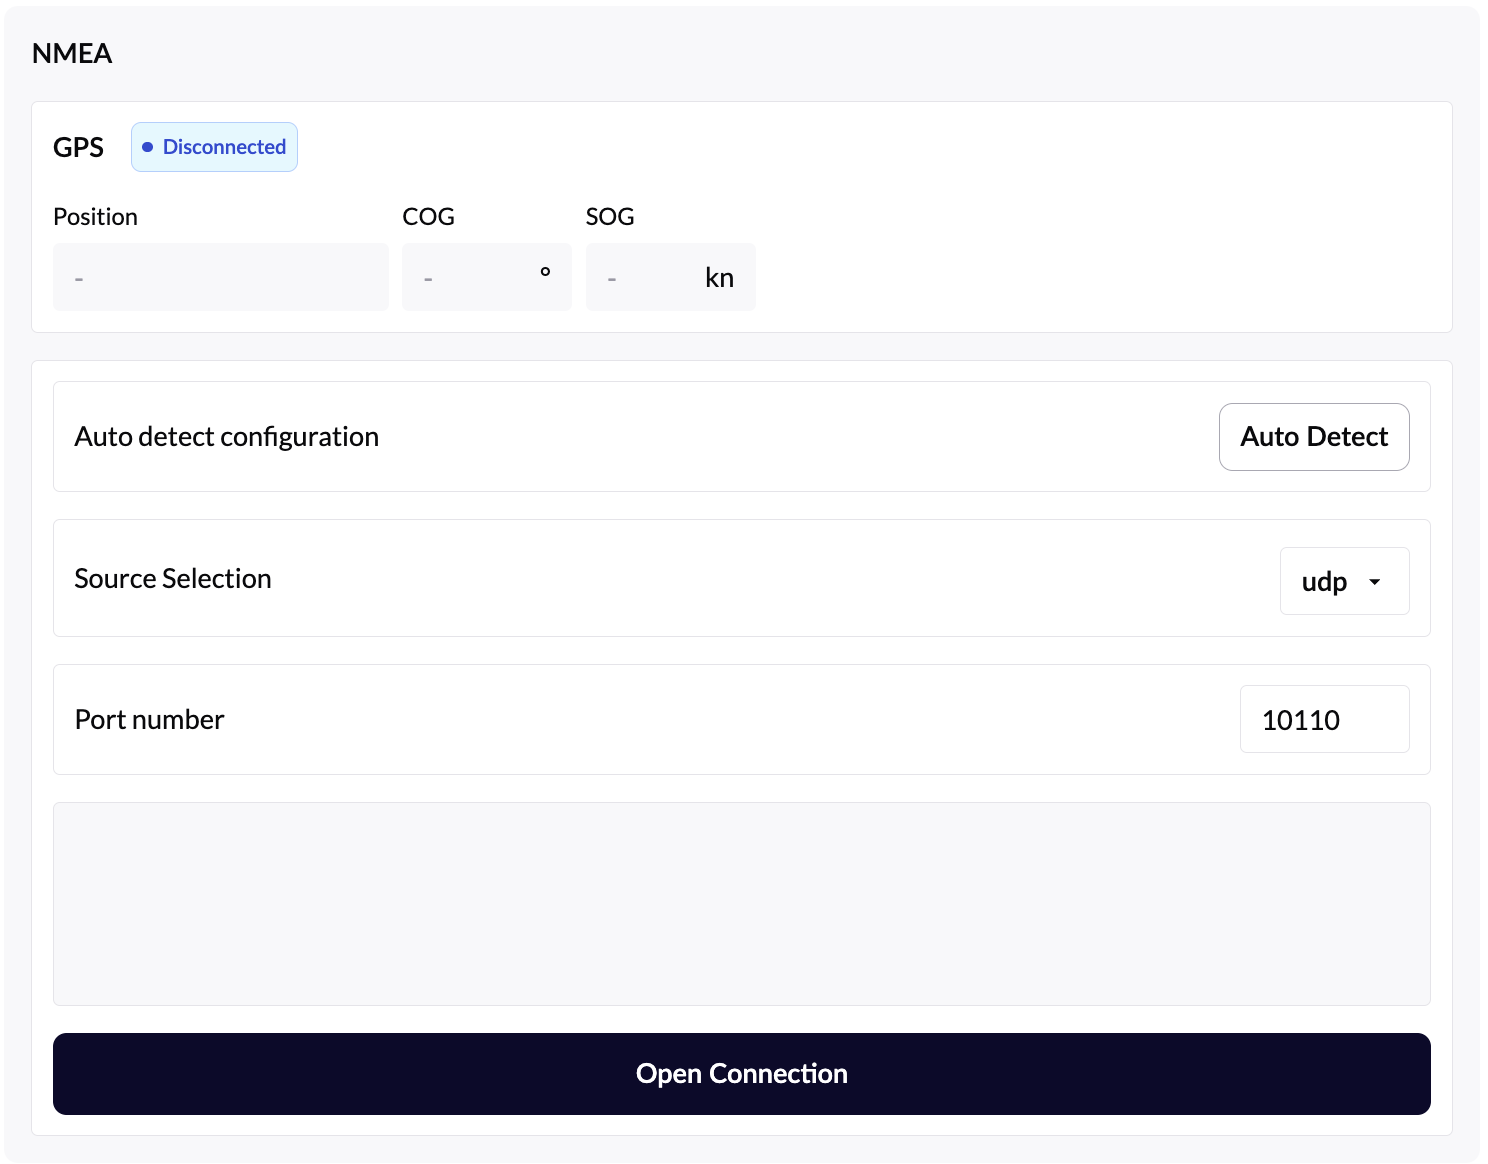
Live values include latitude, longitude, heading, SOG and COG; the raw incoming NMEA feed is also viewable directly, useful when diagnosing missing data or an unsupported sentence.
GPS traces
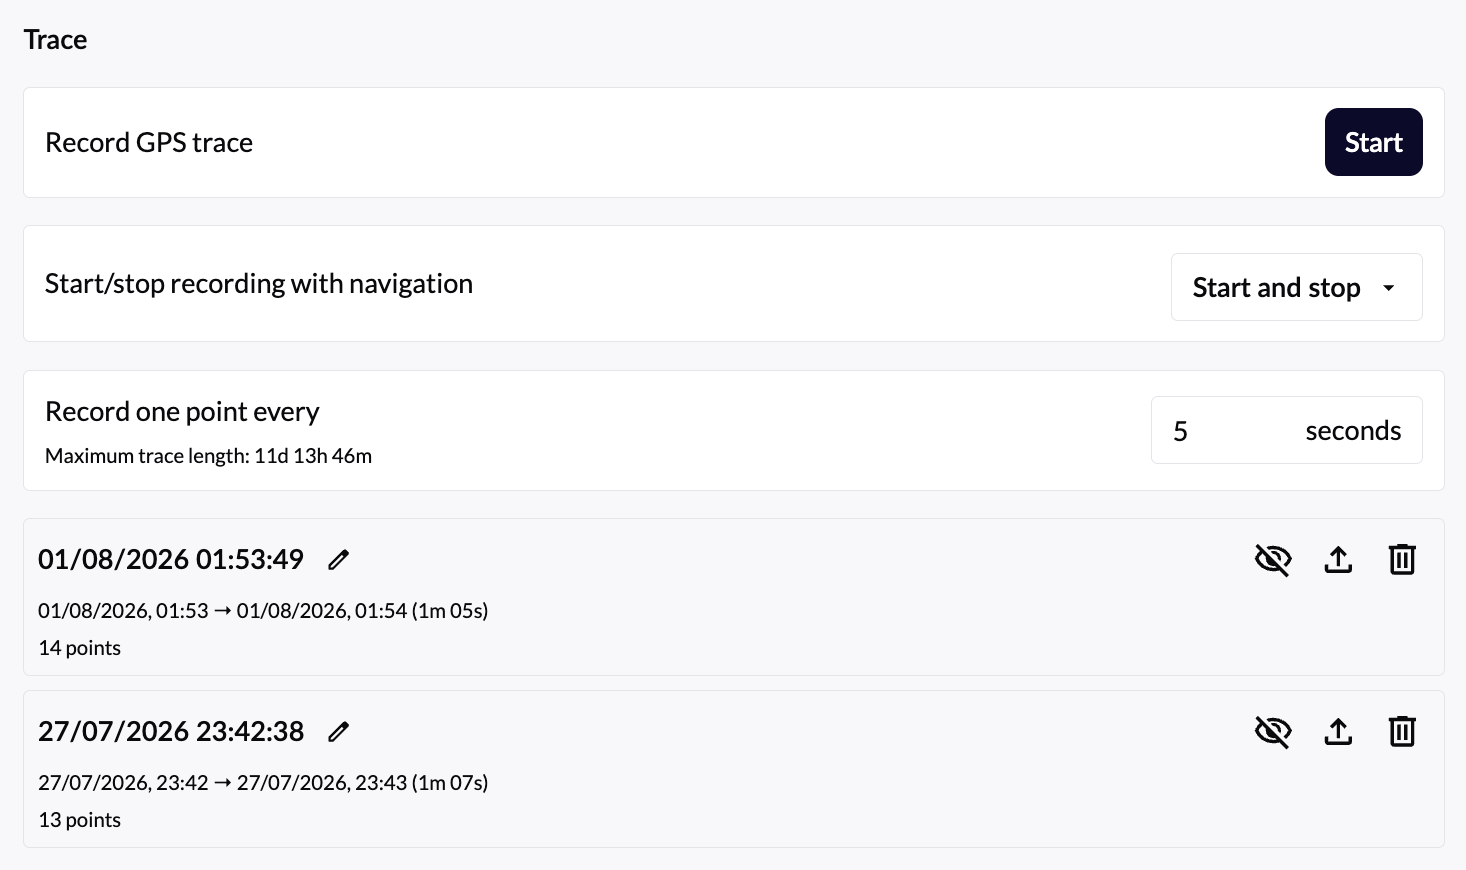
A trace records the vessel's positions over time as a session you can display, review or export later. Start/stop from GPS Trace settings (stopping needs confirmation, since it closes the session); choose a recording interval — finer detail costs more points, which trades off against total recording length. Start/stop can also link to navigation events automatically, independently for each. Export any saved trace as GPX.
Troubleshooting position data
| Symptom | Likely cause |
|---|---|
| Connection already in use | Another app has the serial/network connection open — close it and retry. |
| USB device found, port locked | Detected, but another app has exclusive access — close it and retry. |
| Device connected, no data | Check power, cabling, NMEA output config, and baud rate. |
| No device or network source found | Confirm the equipment is powered and connected. |
| Wi-Fi connected, no valid address | DHCP likely failed — check network config, assign an IP manually if needed. |
| UDP port already in use | Another app is listening on it — close it, or use a different port. |
| No UDP broadcast detected | Confirm UDP output is enabled — some gateways default to TCP and need reconfiguring. |
Importing, Exporting, and Sharing
Every import goes through the Import button on the menu bar; every export lives on the item itself (a route's card, a routing's card, a forecast model's menu).
| Type | Import formats | Goes to |
|---|---|---|
| Grib | .grb2, .grb1, .bz2 | Forecast card |
| Route | .kml, .xml, .rtz, .gpx | Routes card |
| Routing | .kml (type auto-detected) | Routings card, with its route |
| Trace | .gpx | Trace history |
Select several files at once, even mixed formats for routes — each is parsed by its own extension, and one bad file in a batch doesn't stop the rest: you get a specific notification (unsupported format, invalid XML, unreadable content) per failure instead of a silent or total failure.
Exporting
Routes and routings export as KML, GPX, or RTZ (1.0 / 1.1 / 1.2 / Sperry) from their own card. Forecast data exports as GRIB — manually per model, or automatically as new data arrives, in GRIB1 or GRIB2 (set in Export settings). Satellite imagery supports the same kind of automatic export into a folder. Screenshots capture as PNG, copied to clipboard or saved to disk (Ctrl/Cmd+P).
Settings → Export holds independent auto-export toggles and destination folders for GRIB and satellite data, so automating one doesn't affect the other.
Connectivity and Offshore Use
A connection is needed to sign in, download anything new, or reach online charts — but everything already downloaded stays usable offline. The core discipline for offshore use: prepare generously before you lose a reliable connection, and keep requests small once you're relying on satellite bandwidth.
Before departure
Download more than the exact expected duration and track — a delay or diversion can make a tightly-scoped forecast insufficient fast. Use Generate contour from the route editor for a download area with margin, without the size of a full rectangle. Prioritise wind, then wave/current where relevant, tides for the ports involved, and any charts or files another onboard system needs.
Forecast age
Downloaded data doesn't refresh itself — a 5-day forecast grabbed before departure is still there days later, but it's an aging model run missing every correction since. Refresh whenever a connection allows, especially with a front or low evolving, models disagreeing, or a major routing decision riding on it.
Over a satellite connection (Iridium GO! and similar)
Squid just uses whatever network path the vessel provides — connect to the onboard Wi-Fi, confirm the satellite session is actually up (a Wi-Fi link to the terminal doesn't guarantee a working data session behind it), then request data as normal. Expect high latency and occasional failures rather than a dead connection; if a request stalls, check signal and session state before assuming the data itself is unavailable.
Keep requests lean: fewer variables, a smaller or route-shaped area, lower resolution unless you're near a coast, fewer forecast hours, and trimmed satellite history/frequency — update the most operationally important dataset first rather than everything at once. A failed download doesn't touch data you already have; don't delete the old forecast until its replacement has actually finished.
Departure checklist
- Account & subscription confirmed
- App updated
- Route created & checked
- Wind + wave/current downloaded
- Margin for diversions
- Routing run & saved
- Tides for relevant ports
- Charts available offline
- GPS/NMEA tested
- Satellite link tested
GPS/NMEA and trace recording are entirely local and keep working with zero internet — losing the connection never removes your position display when an onboard source is connected.
Settings
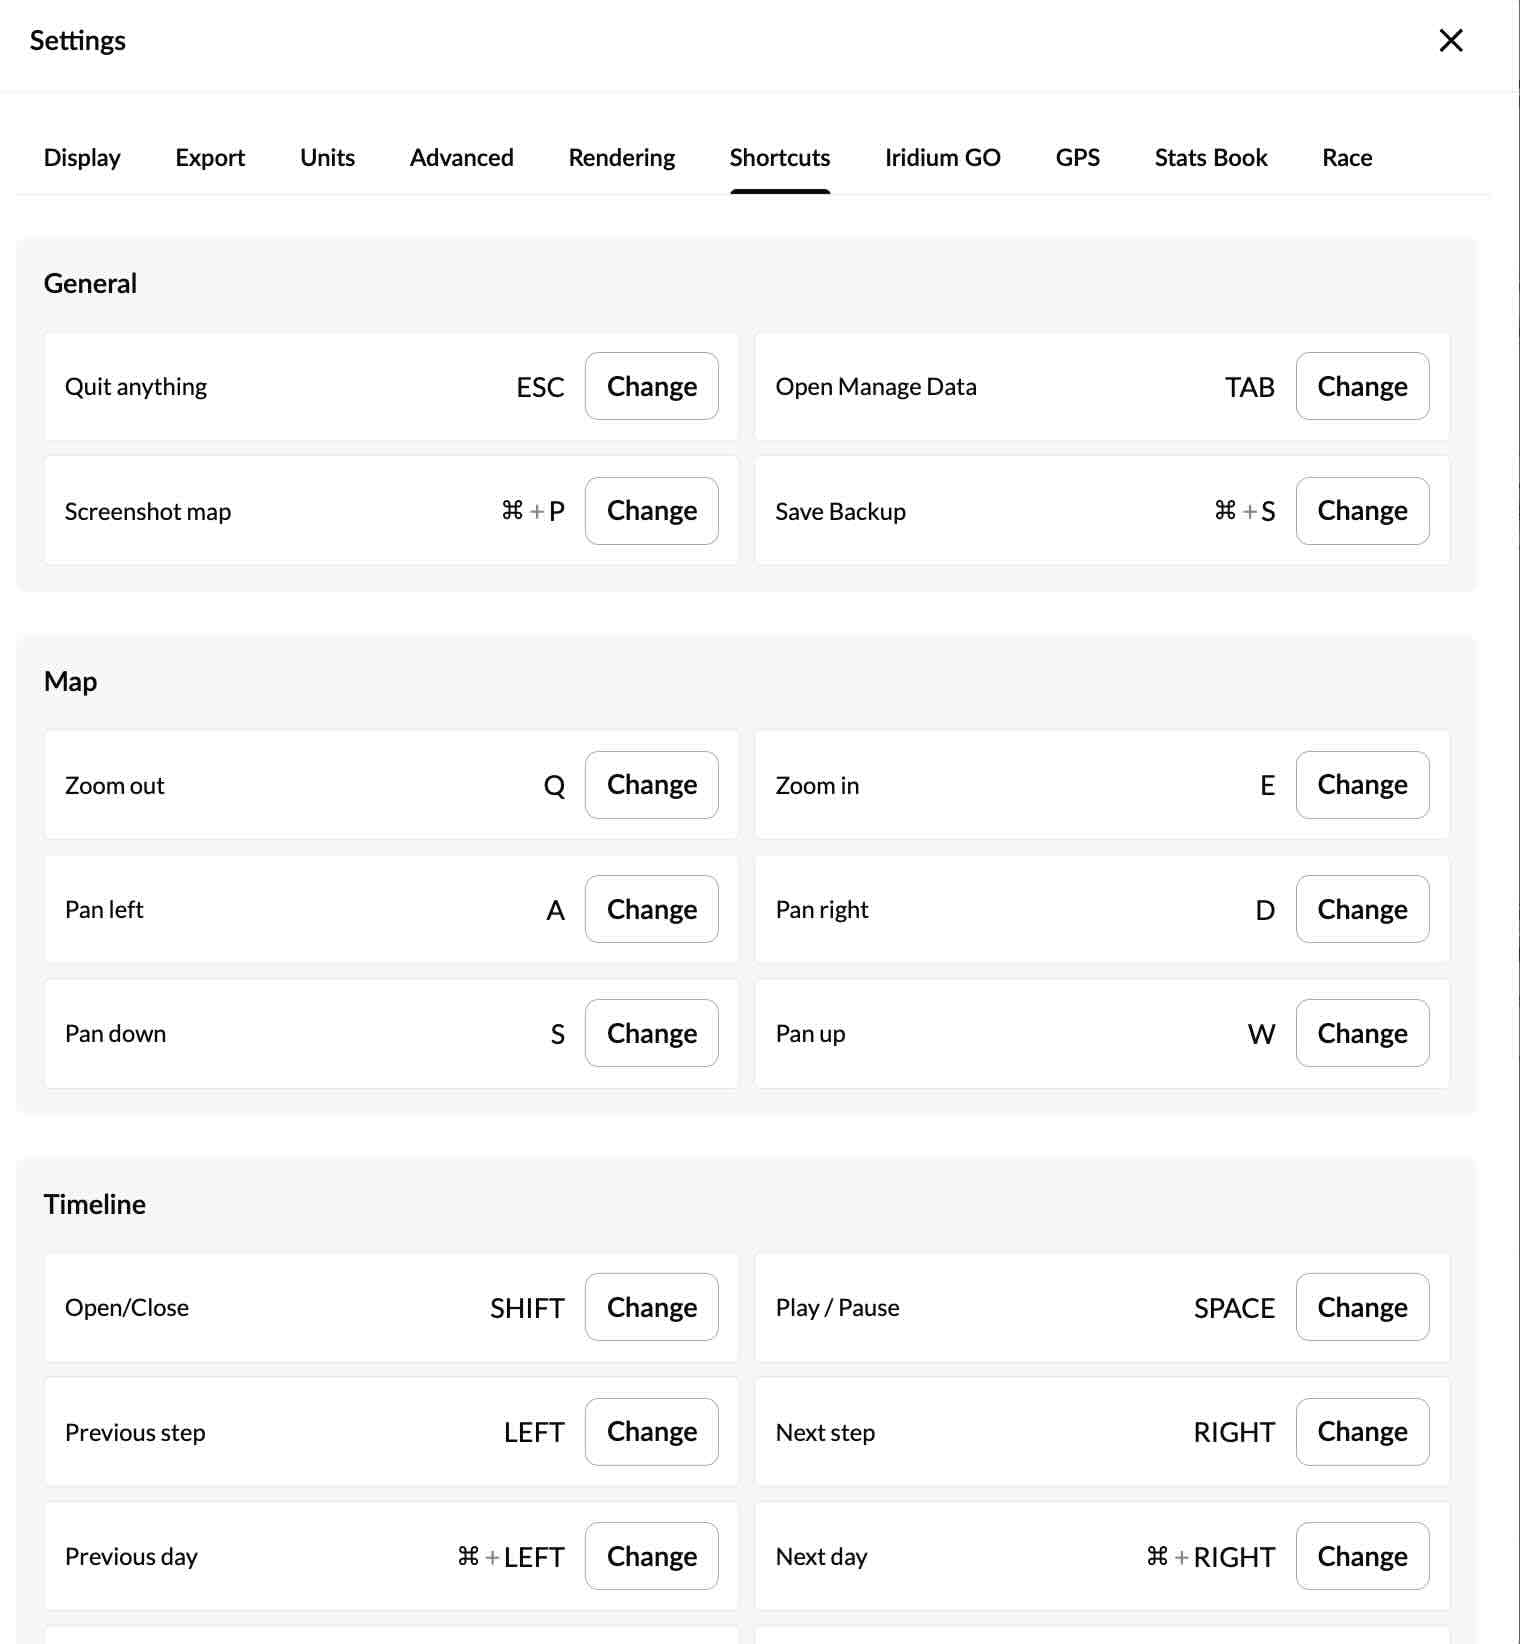
Open from the gear icon on the menu bar. Organized by what each tab affects, rather than one flat list:
| Tab | Covers |
|---|---|
| Display | Interface theme (Light / Dark / Night / Retro / Legacy) and per-model colours, used to tell overlapping forecasts apart on the map, chips and timeline. Also sets interface language and UI scale (manual slider, or auto-detected to match your display). |
| Rendering | How forecast layers are drawn by default — streamline size and behaviour, heatmap style, and isoline (contour) style — independent of which layers or variables you've chosen to display. Changes apply immediately to layers already on the map. |
| Units | Coordinate format only (DD / DM.2 / DM.3 / DMS / DMS decimal) — other units are set contextually where the data itself appears. |
| Export | GRIB and satellite auto-export toggles, destination folders, GRIB1/GRIB2 choice. See Importing, Exporting & Sharing. |
| Advanced | Catalog refresh, auto-update on startup, server connectivity test, and data reset. The connectivity test checks the weather/routing server and, on Squid accounts, the Tactics server independently — each reporting its own status and clock-offset diagnostic, so a routing-server outage and a Tactics-server outage aren't confused for one another. |
| Shortcuts | Every keybinding, remappable. See Keyboard & Mouse Controls. |
| GPS | Squid GPS connection and trace recording. See Boat Position & Navigation Data. |
| Iridium GO! | Live device status once paired — signal, connection, position, call status, battery. |
| Stats Book | Points the performance-logging database at a file location. |
| Race | Position-report source (local files or FTP), entry list, auto-refresh. See Race & Performance Features. |
Language preferences
Choose the interface language from Settings → Display → Language. Squid currently offers English, French, German, Italian and Spanish. The language selection changes the labels and navigation used throughout the desktop application.

Interface size
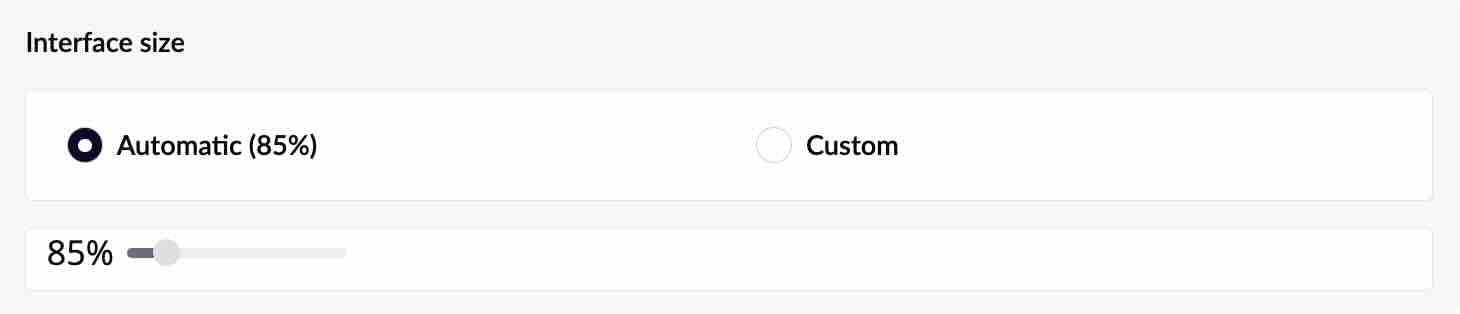
Interface size controls the scale of the desktop UI. Automatic uses the detected display scale (shown as a percentage, such as 85%), while Custom enables the slider so you can choose a different size. Use a larger value for a high-resolution display viewed from a distance, or a smaller value when you need more map area on screen.
Rendering preferences
Rendering preferences control how weather layers are drawn, independently of which variables or layers are enabled. Changes apply to the relevant layer wherever it is displayed, so you can tune the map for legibility without changing the underlying forecast data.
For isolines, Step between isolines sets the interval between contour lines: a smaller step shows more detail, while a larger step produces a cleaner view with fewer lines. Adjust the value when the map feels too dense or when you need to make smaller gradients easier to distinguish.

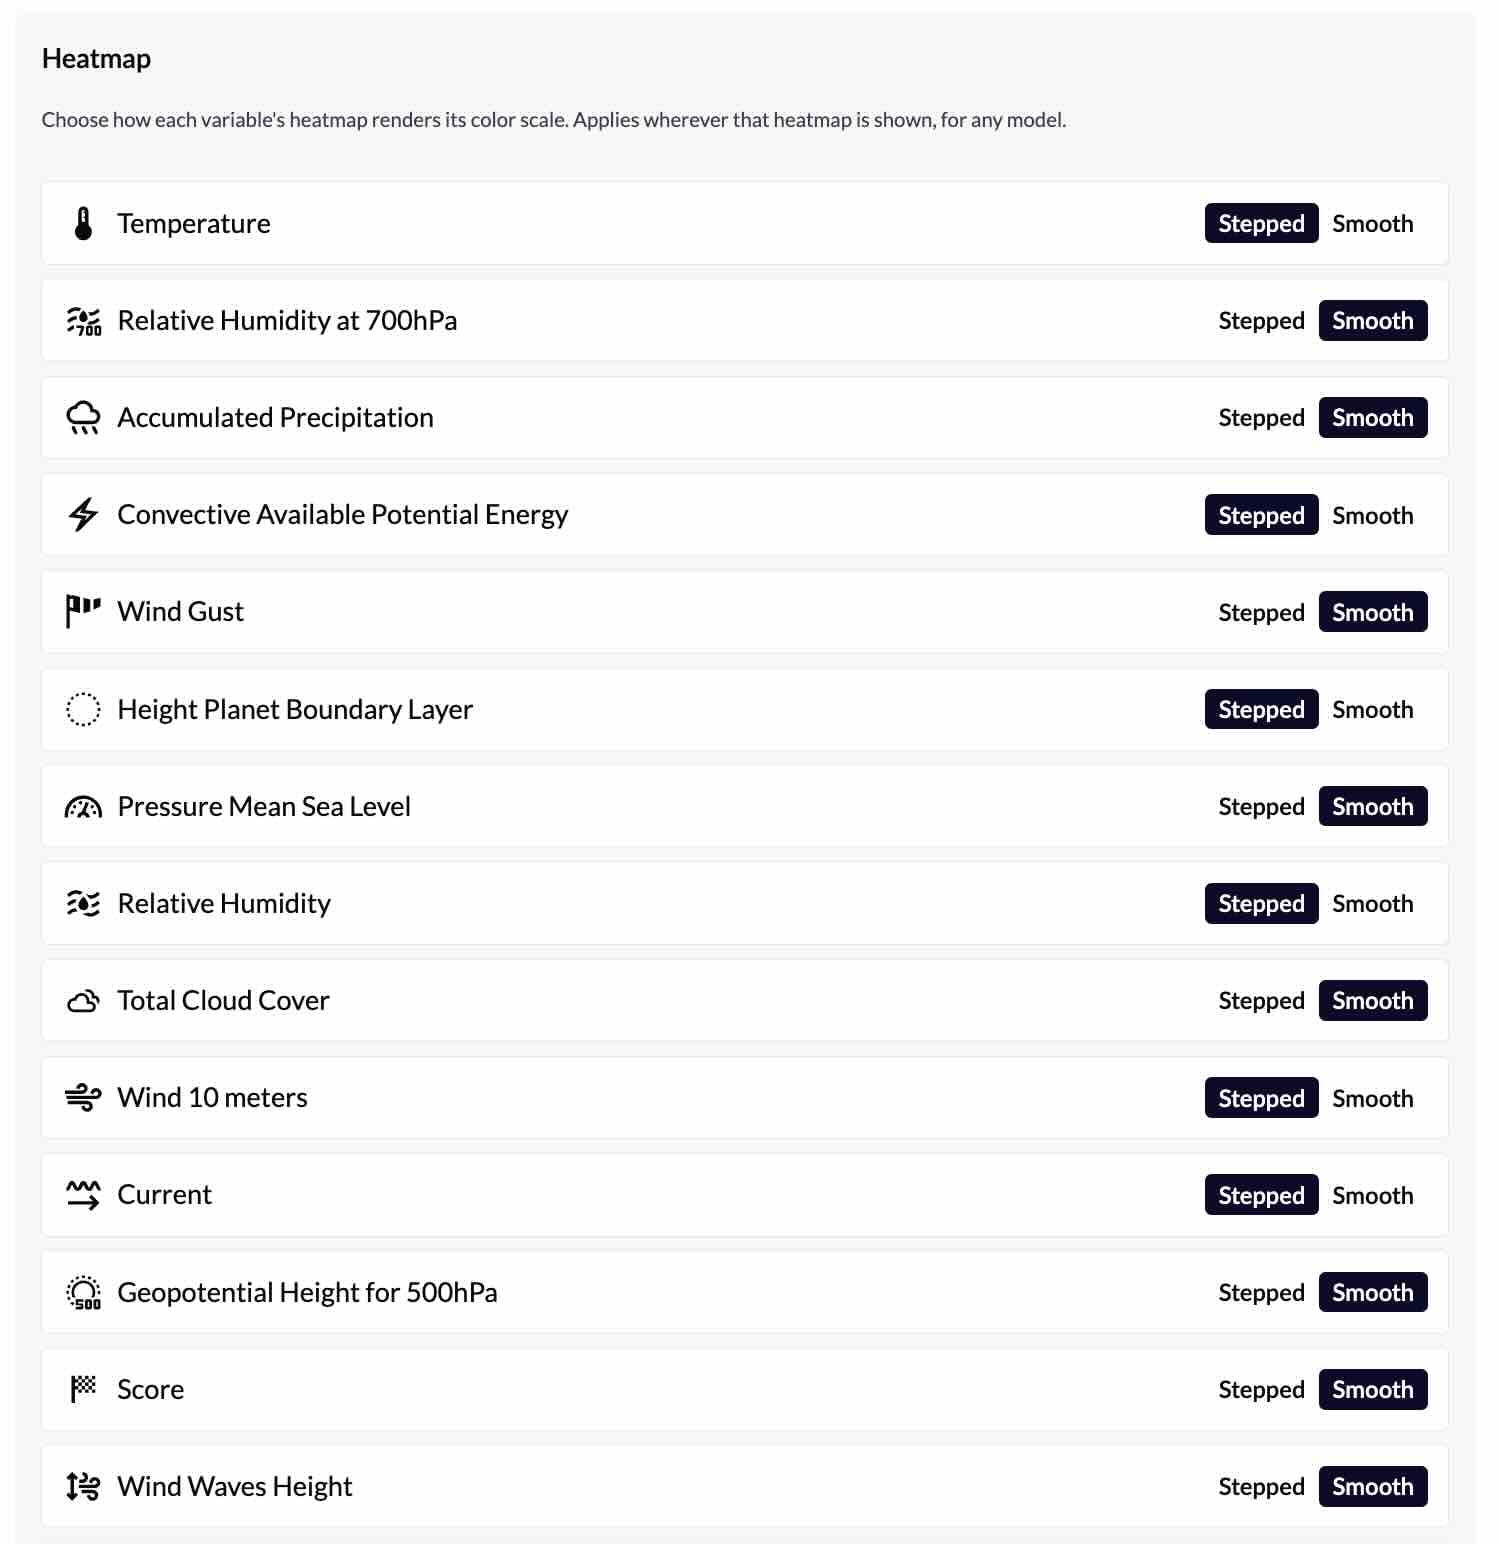
For heatmaps, choose Stepped or Smooth independently for each variable. Stepped rendering divides the colour scale into clear bands, which can make thresholds and ranges easier to compare; Smooth rendering blends between values for a continuous-looking field. The selected mode is remembered per variable.
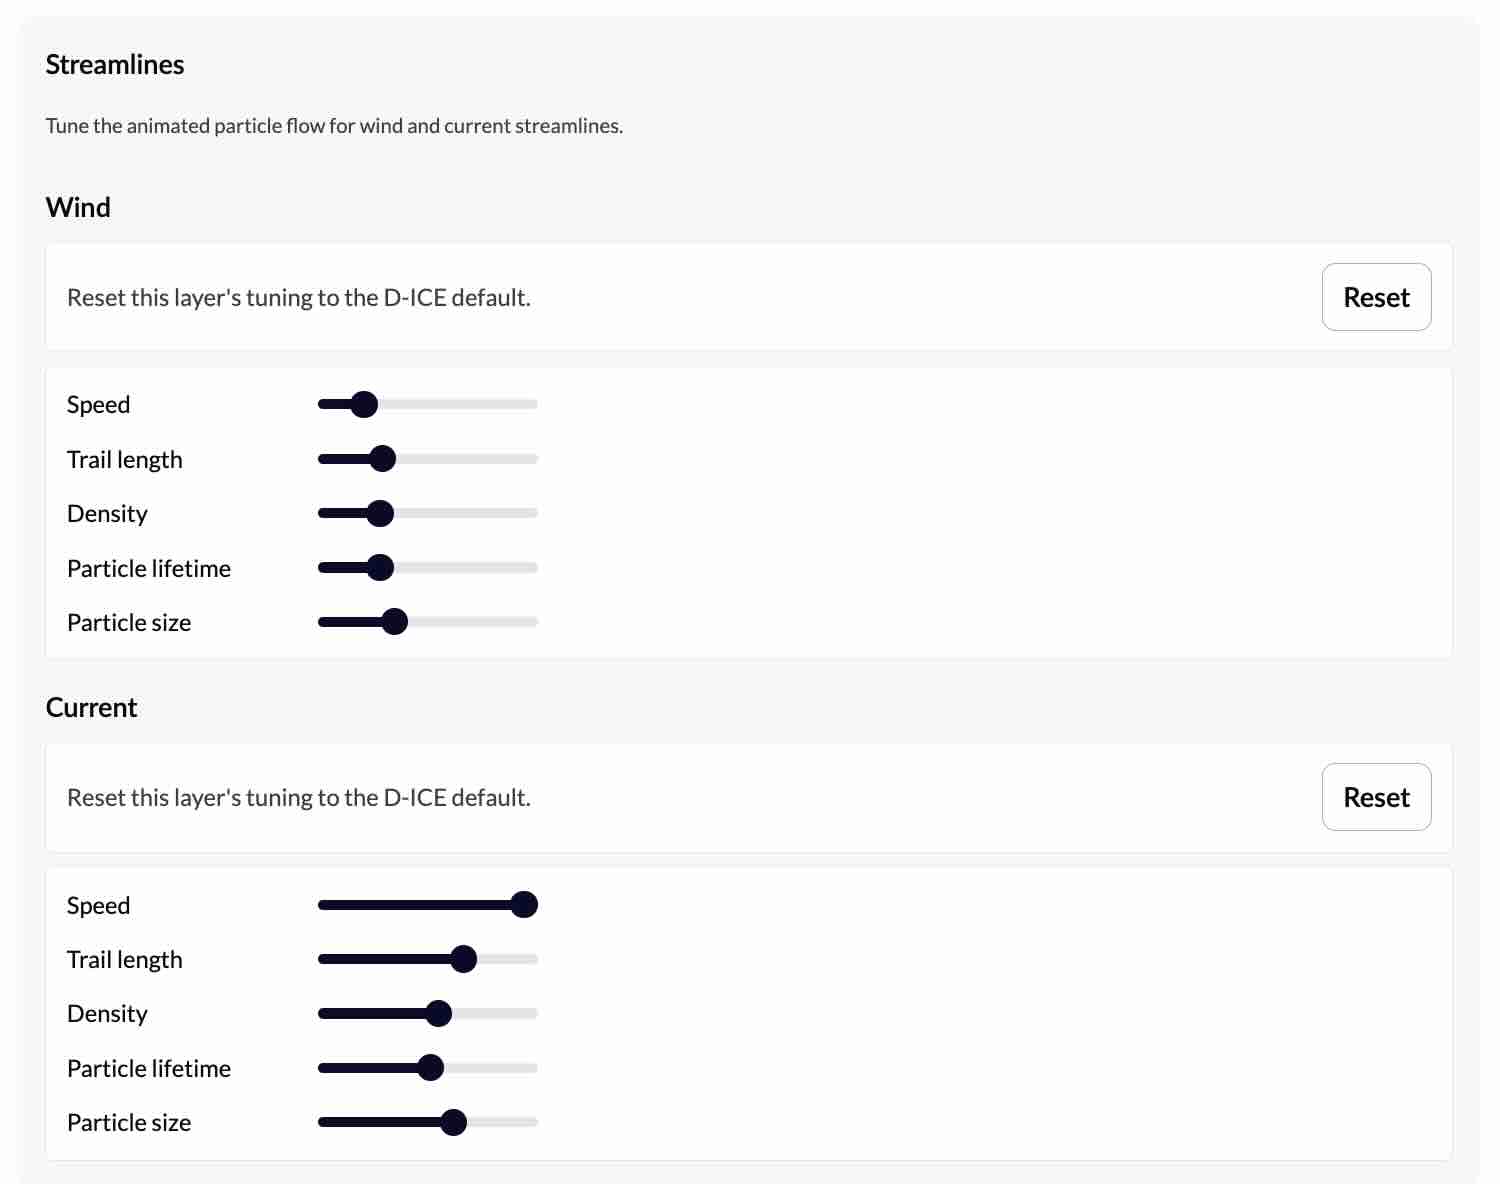
For animated streamlines, tune wind and current separately. Each has a reset action plus controls for Speed, Trail length, Density, Particle lifetime and Particle size. Increase trail length or particle lifetime to make flow direction easier to follow; reduce density or size when the map becomes visually busy.
Restoring defaults
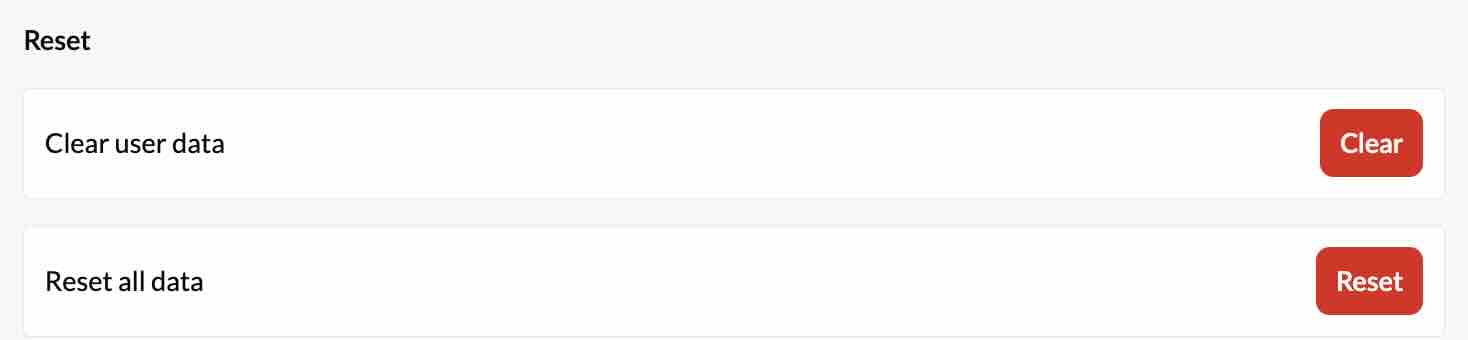
The Advanced tab's Reset lets you clear specific categories — user settings, catalog, shortcuts, forecast, routing, observations, tides, routes, cartography, points of interest, exclusion zones — individually, or everything at once with Reset All. Both require confirmation; neither can be undone.
Race and Performance Features
Race Report
Track a fleet's positions from a local file feed or FTP source, configured in Settings → Race along with the boat entry list and an optional auto-refresh timer. Once enabled, boats appear on the map as position-and-heading marks plus historical tracks, in sync with the shared timeline — scrub it and the fleet replays. A Timeline Granularity control (All down to weekly) thins how many trace points draw, so a multi-day race doesn't drown the map.
Click or hover a boat for skipper, boat name, rank and report time.
Stats Book
Separate from Race — this logs your own vessel's sensors (position, heading, true wind speed/direction, pressure) continuously into the database file set in Settings, drawing from whichever GPS trace session is currently active. That file is portable, so keeping it somewhere you can find later is effectively how you "export" it.
Keyboard and Mouse Controls
Every shortcut is remappable from Settings → Shortcuts. Layout is auto-detected at startup — the map-navigation keys below shift automatically between QWERTY and AZERTY so they land in the same physical position either way.
| Category | Action | QWERTY | AZERTY |
|---|---|---|---|
| General | Close / quit panel | Esc | |
| Manage data | Tab | ||
| Screenshot | Ctrl/Cmd+P | ||
| Save backup | Ctrl/Cmd+S | ||
| Map | Zoom out / in | Q / E | A / E |
| Pan up | W | Z | |
| Pan left / right | A / D | Q / D | |
| Pan down | S | ||
| Chips | Open chip 1–6 | 1–6 | |
| Open its Add panel | Ctrl/Cmd+1–6 | ||
| Recovery | Diagnostic trace | Ctrl/Cmd+Shift+S | |
| Wipe local data | Ctrl/Cmd+Shift+D | ||
Chips 1–6, in order: Forecast, Observations, Routings, Routes, Tides, Synoptic Maps. Timeline shortcuts are covered fully in Timeline & Animation. There are no touch-specific gestures — the interface is built around mouse, trackpad and keyboard, so a touchscreen only works through whatever pointer emulation the OS provides.
Data Backup and Recovery
Ctrl/Cmd+S (or the menu bar) saves a backup of your app settings and catalog state, rotating through up to 5 generations automatically. It also runs automatically in the background on certain data changes, not only when triggered manually.
What's not included: a backup covers settings and catalog state, not a full copy of every downloaded forecast, image or observation. For anything you need to keep long-term, use the explicit exports throughout this guide (routes, routings, GRIB, traces) rather than relying on backup alone.
Ctrl/Cmd+Shift+S captures a diagnostic trace instantly (only one is kept at a time) — useful evidence when reporting a problem. Ctrl/Cmd+Shift+D opens a confirmation dialog for a full application reset — irreversible, so treat it as a last resort; Settings → Advanced → Reset offers the same thing with finer, per-category control (see Settings).
Troubleshooting
| Problem | Try this |
|---|---|
| Cannot sign in | Run Diagnostics — it checks authentication independently, telling you whether it's your credentials or the service itself before you waste time guessing. |
| Forecast won't download | Check it's actually selected in the Request Hub, and that the area/time range isn't unreasonably large. Diagnostics' Weather Services check covers forecast, model-status and observation connectivity together. |
| Forecast downloaded but not visible | Confirm it's toggled on in the carousel (downloading ≠ displaying), and that the timeline's selected time actually falls inside that model's coverage. |
| Selected time is outside the data range | Look for the arrow at the edge of that source's timeline row and click it to jump straight to its data — see Timeline. |
| Map or chart tiles missing | Usually a tile-server connectivity issue rather than a data problem; a lock icon on a specific layer means a subscription gap, not a fault. |
| Globe display looks wrong | Switch back to Mercator and back to Globe to force a rebuild — same recovery the app uses for other rendering glitches. |
| Observation / synoptic map unavailable | Check for a lock icon first — some products are subscription-gated rather than broken. |
| Routing calculation fails | Confirm the route has 2+ waypoints and a wind model is selected (the one required input). Check Diagnostics' Routing Services if it starts but never finishes. |
| GPS position missing | See the GPS troubleshooting table — auto-configure's error messages name the specific problem. |
| Iridium GO! won't connect | Confirm the computer is on the device's own Wi-Fi hotspot, not your regular internet — this talks to the device directly, not through your normal connection. |
| App is slow | A very large number of datasets, an overly complex route, or a huge routing search area can all cost performance. If it's specifically the map that's unresponsive, see WebGL below. |
| WebGL / graphics problems | The map already recovers automatically from a lost WebGL context (a known Windows/GPU-driver issue) by rebuilding itself. If it's still broken afterward, update your graphics drivers. |
Diagnostics & support
Run Diagnostics (Help menu) to independently check four things: file system access, weather services, routing services, and authentication — each reports success or a specific reason for failure, which is the fastest way to narrow down a problem before contacting support.
Open a support request from the same menu: describe the issue, optionally check Include diagnostic information to attach the results above, and it's emailed to the help desk along with your login, app version and active subscriptions — no need to describe your setup from scratch.
Appendix A · Forecast Variables
| Wind | Speed and direction at reference height — barbs, streamlines, or heatmap. |
| Gusts | Peak speed over a short interval, distinct from sustained wind. |
| Pressure | Mean sea-level, usually shown as isobars — spacing indicates gradient strength. |
| Temperature | Air temperature; some models also give sea-water temperature separately. |
| Precipitation | Rainfall rate or accumulation, where the model provides it. |
| Waves & swell | Height, direction and period — primary waves distinguished from swell where supported. |
| Ocean currents | Speed and direction, displayed the same way as wind. |
Not every model provides every variable — the selection panel only offers what the chosen model actually publishes.
Appendix B · Units and Direction Conventions
| Wind direction | Where it's coming from. |
| Wave / current direction | Where they're going to — opposite convention from wind. |
| Bearings | True, not corrected for magnetic variation. |
| Speed / distance | Knots and nautical miles throughout. |
Coordinate formats
- DD — ±DDD.ddddd°
- DM.2 — DDD° MM.mm′
- DM.3 — DDD° MM.mmm′
- DMS — DDD° MM′ SS″
- DMS decimal — DDD° MM′ SS.ss″
Set globally in Settings → Units.
Appendix C · File Formats
| GRIB | .grb2 / .grb1 / .bz2 in, GRIB1 or GRIB2 out — the meteorological standard. |
| KML | Google Earth format; also the only format that can carry a full routing on import (auto-detected), not just a route. |
| RTZ | ECDIS/chart-plotter exchange, in four variants: 1.0, 1.1, 1.2, Sperry. Routes and routings export; only routes import. |
| GPX | Routes and GPS traces alike — widely supported elsewhere. |
| Screenshots | PNG, clipboard or disk. |
| Backups | A rotating local snapshot set, not a portable transfer format. |
Appendix D · Glossary
Forecast & routing
- Route
- A sequence of waypoints you define.
- Routing
- A weather-optimized calculation from a route.
- Direct route
- The unoptimized straight-line baseline a routing is compared against.
- Isochrone step
- The temporal resolution of the routing calculation.
- Contour
- A generated search corridor around a route.
- Hard / Soft waypoint
- Must-pass-exactly, vs. deviation allowed within a radius.
Marine navigation
- TWA / TWD / TWS
- True wind angle / direction / speed.
- AWA / AWS
- Apparent wind angle / speed — as felt aboard, combining true wind with the boat's own motion.
- SOG / COG
- Speed / course over ground.
Sailing & performance
- Polar
- A diagram of expected boat speed at each wind angle and strength.
- Polar factor
- Percentage scaling applied to that performance.
- Motor Sailing
- Engine assist below a configured wind threshold.
- Best-start
- Searching a window of departure/arrival times for the best one.
- Grouped routing
- Multiple related sub-results (best-start or ensemble) shown together.
- Race Report
- Live tracking of other boats from position-report files or FTP.
- Stats Book
- Logged history of your own vessel's sensor data.