BestSails - Climatological study
The Best Sails allows you to carry out your climatological study on a chosen route with the best historical weather (wind & waves) data and a large remote computing capacity to calculate tens of thousands of routing in a few hours. Many boat architects & designers, sailing teams and sail-makers already use it.
BestSails is the perfect tool for:
- design a race course based on weather historical data,
- analyse the probability of breaking a record,
- design the winning sailboat in line with her agenda,
- choose a sail set to perform on a specific course
- access weather statistics on wind angles, speed, waves, gusts, ...
- know the use of sails on a given course
- compare the effectiveness of different sail sets on the same course
How does it work ?
BestSails can be set through a very intuitive user interface that does not require any particular computer skills. We will provide you with the address of the web page and a login / password so that you can perform the setting of the desired analyzes by yourself.
Our remote algorithms and servers will then carry out all the route calculations to produce a detailed report presenting all the statistics on the chosen route, for the given polar (and Sailect) and on the planned starting range of dates.
These climatological routing is based on historical ECMWF weather data for the last 12 years (resolution 0.20 °).
Forecast your future performance with data from the past.
Here is an example of a Best-sails report.
Pricing
For a single user (one login), prices are taxes excluded :
By periodical subscriptions :
- Annual: € 14,980
- Monthly: € 3,900
- Weekly: € 2,900
=> -20% for a second license (2 simultaneous accesses)
By "run" (= one course, one polar, one range of starting dates):
- 900 € / run with D-ICE Engineering's human technical assistance for the configuration of the course, etc.
- 550 € / run in standalone use via the dedicated web interface
Interested?
A simple and intuitive interface!
We have implemented an intuitive user interface assuring easy access to this wonderful analytics not requiring highly skilled IT skills. Here are some screenshots to convince you.
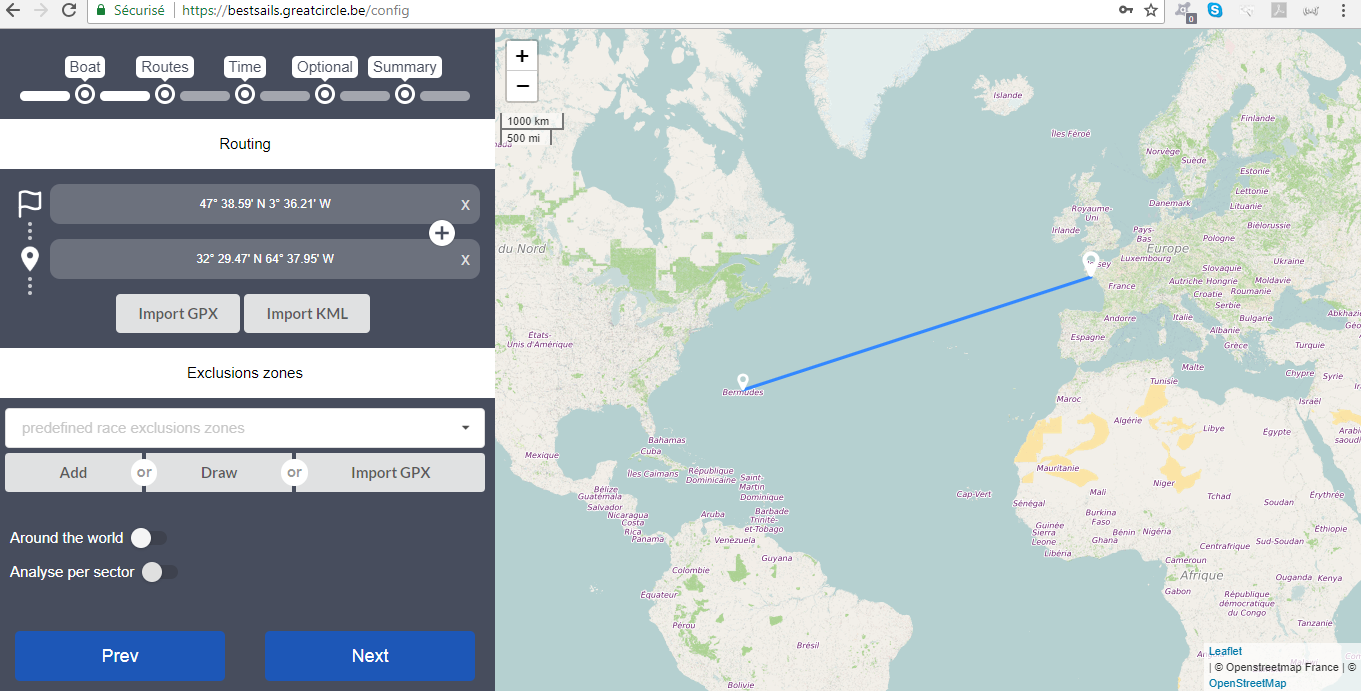
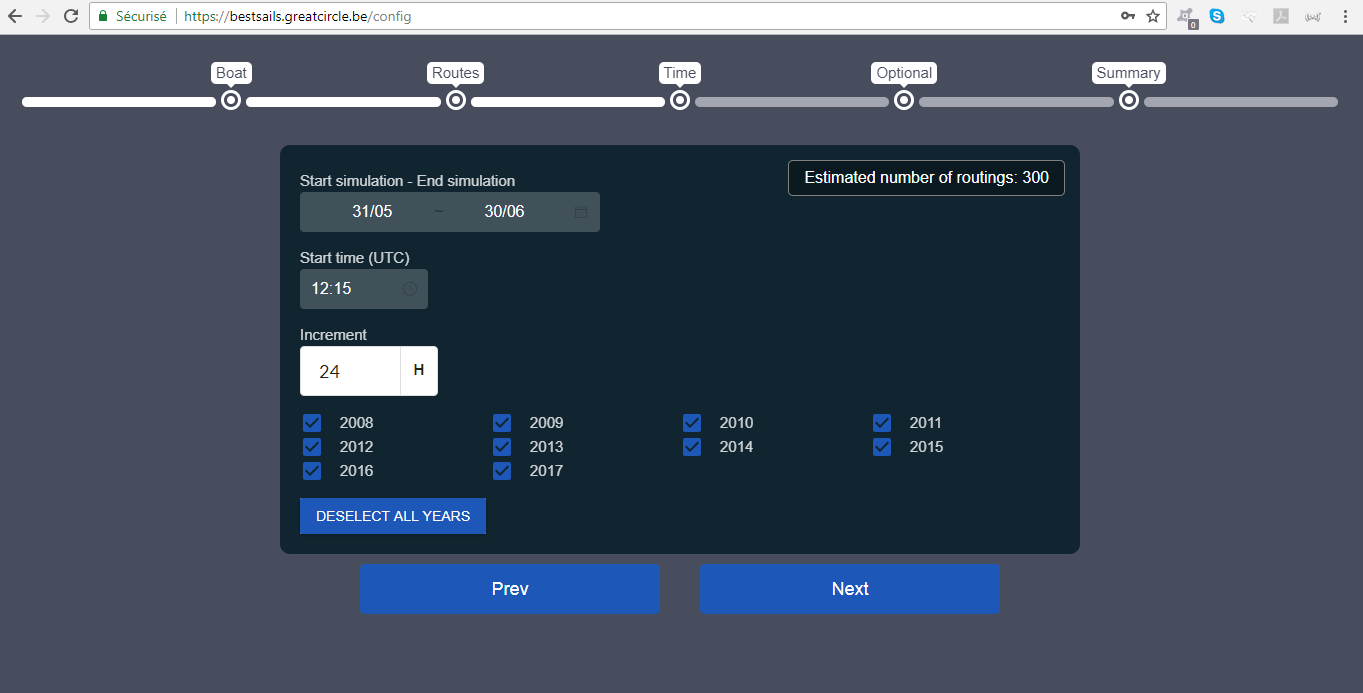
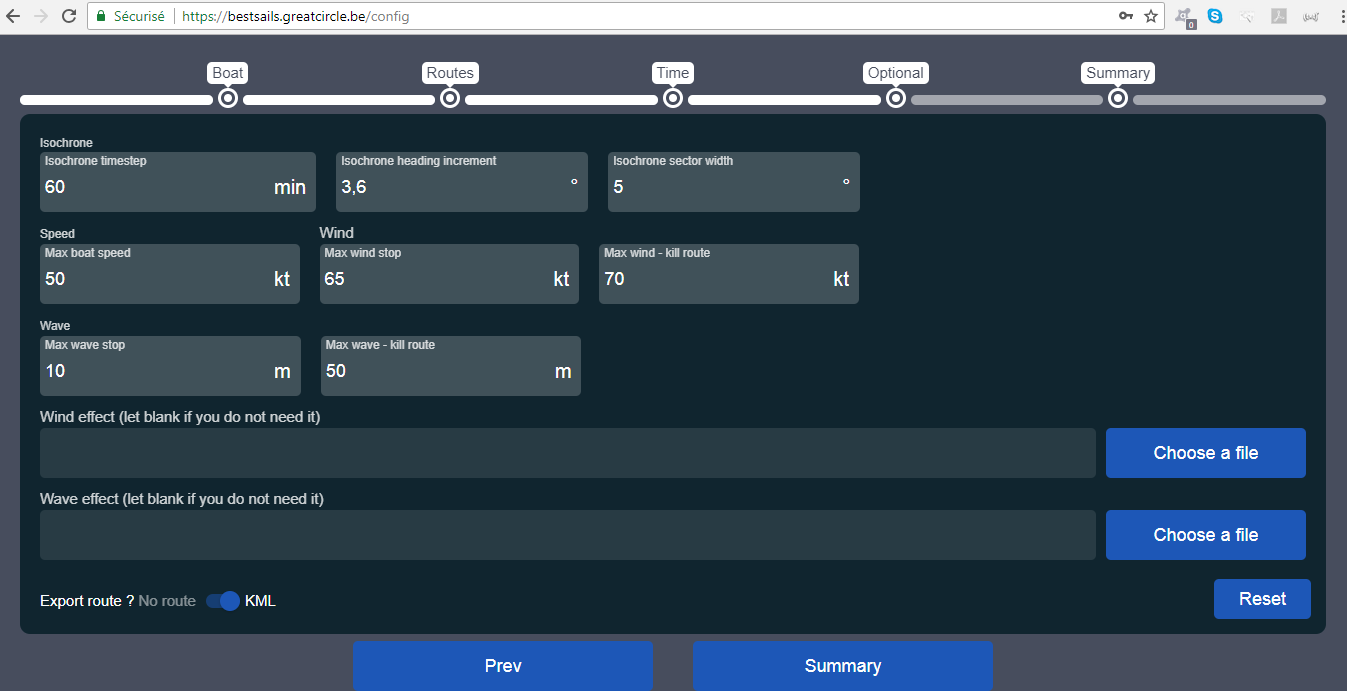
Our staff is of course available to further help you get the most of this powerful climate analysis tool.